BRAINNWAVE MARKETPLACE
Product lead, UX design, UI design, Information architecture
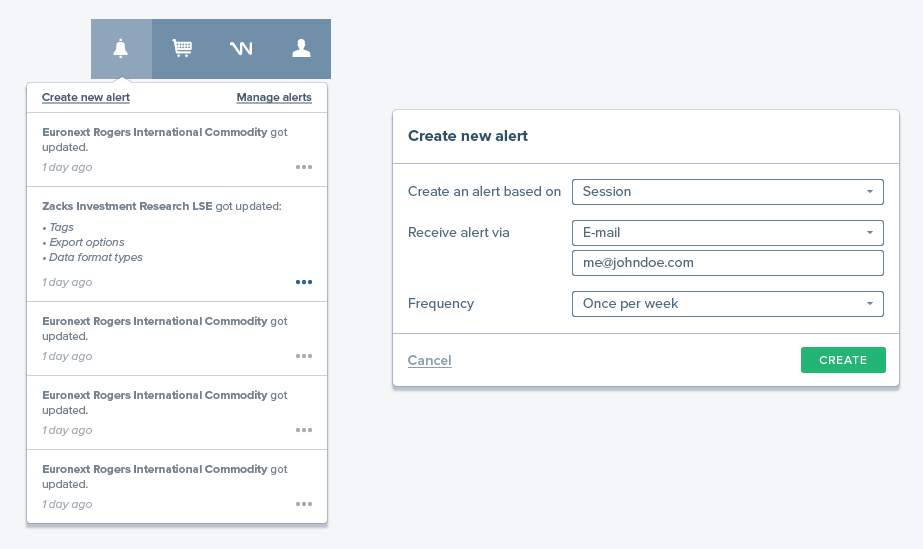
A platform combining a data marketplace, a data-visualisation and dashboard editor, and a social platform for professionals and academics.
Brainnwave is a start-up which aimed to simplify the way data was searched, bought and used. They approached us to design a marketplace that would help professionals and academics search and access relevant data files, manage their library of data and visualisations, and connect with peers.
A second part of of the project then involved adding a geographic information system to the marketplace allowing to search satellite imagery.
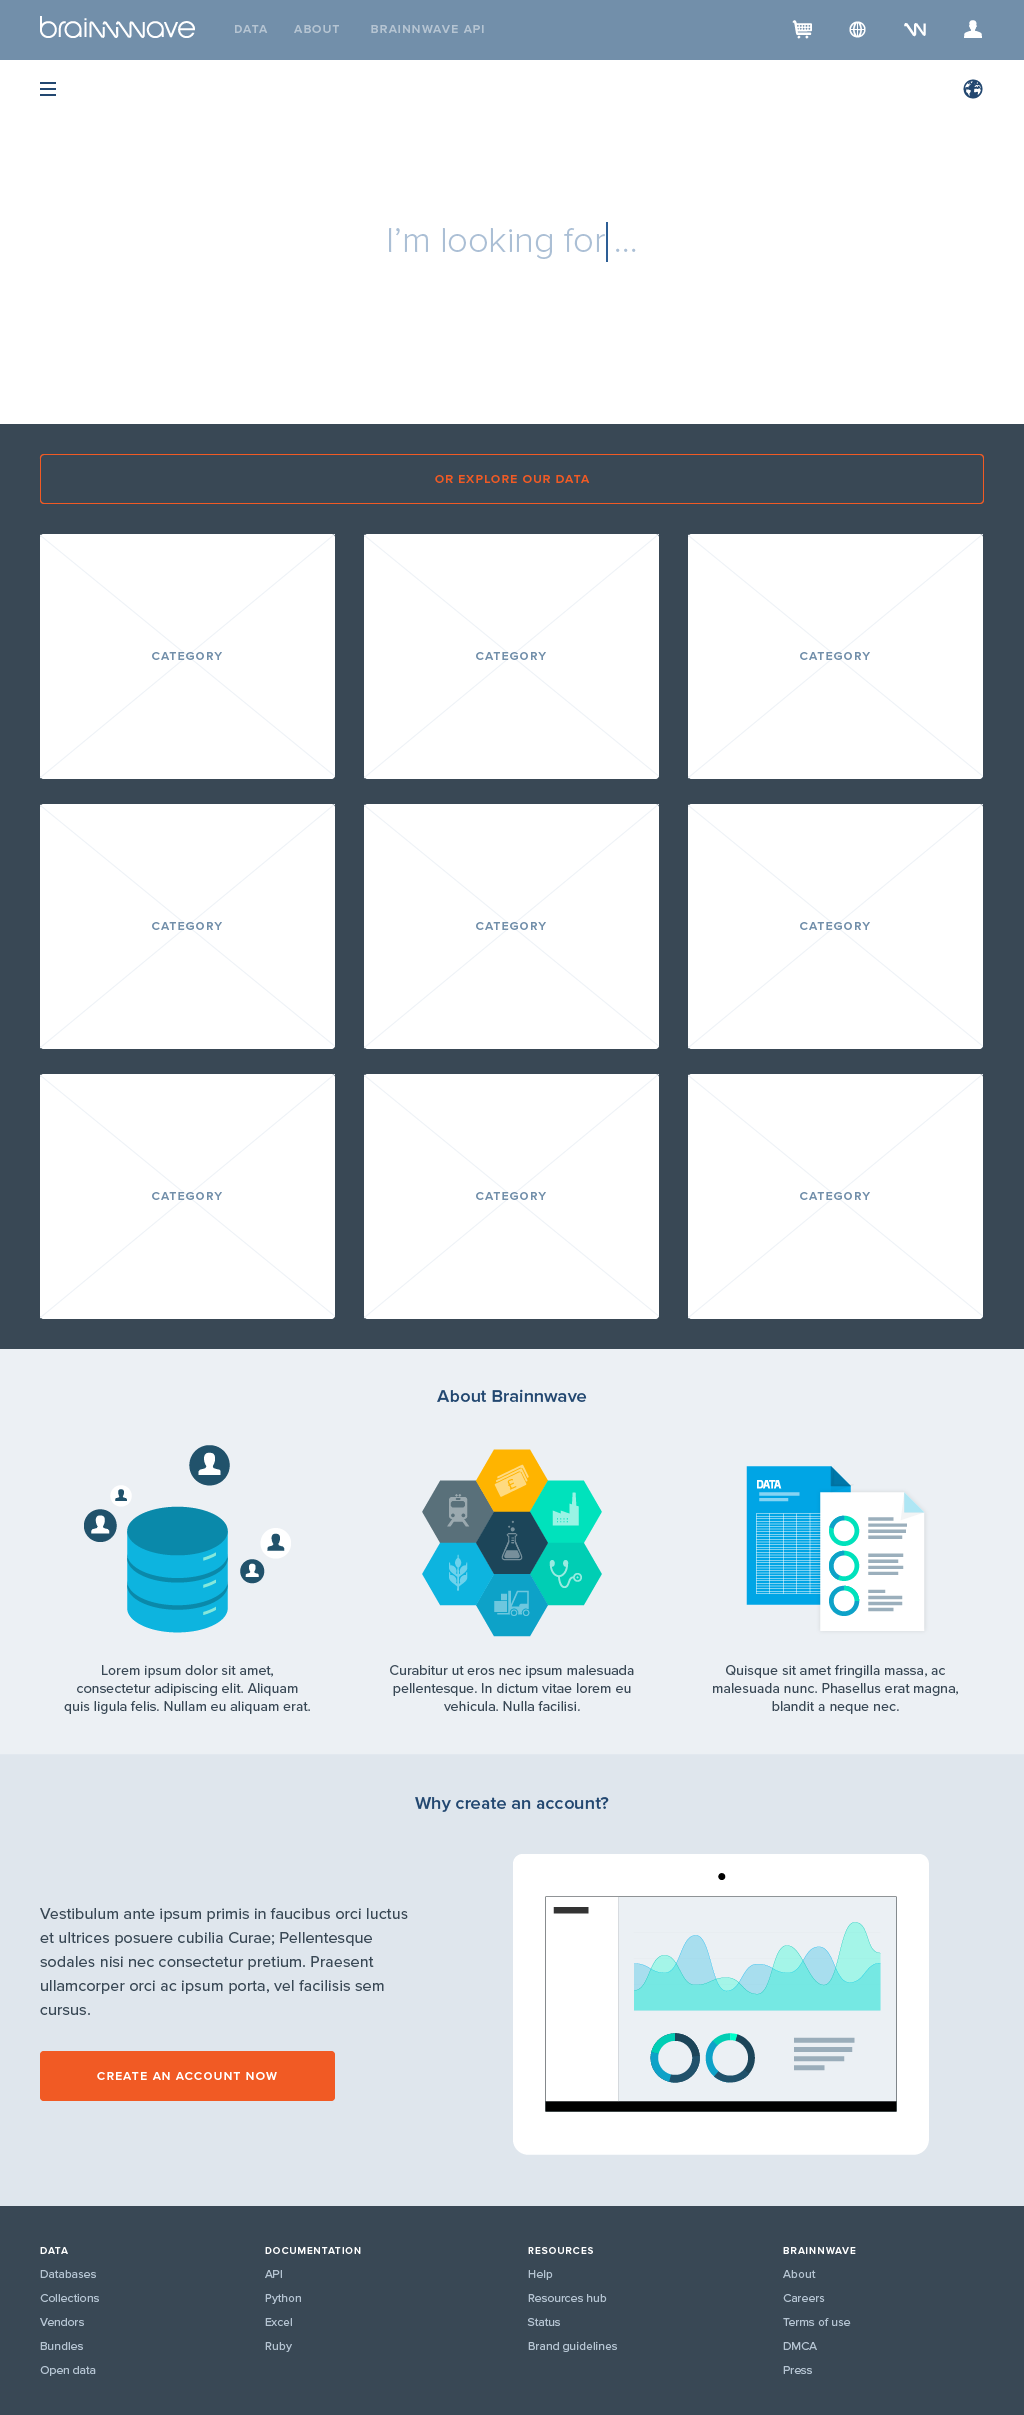
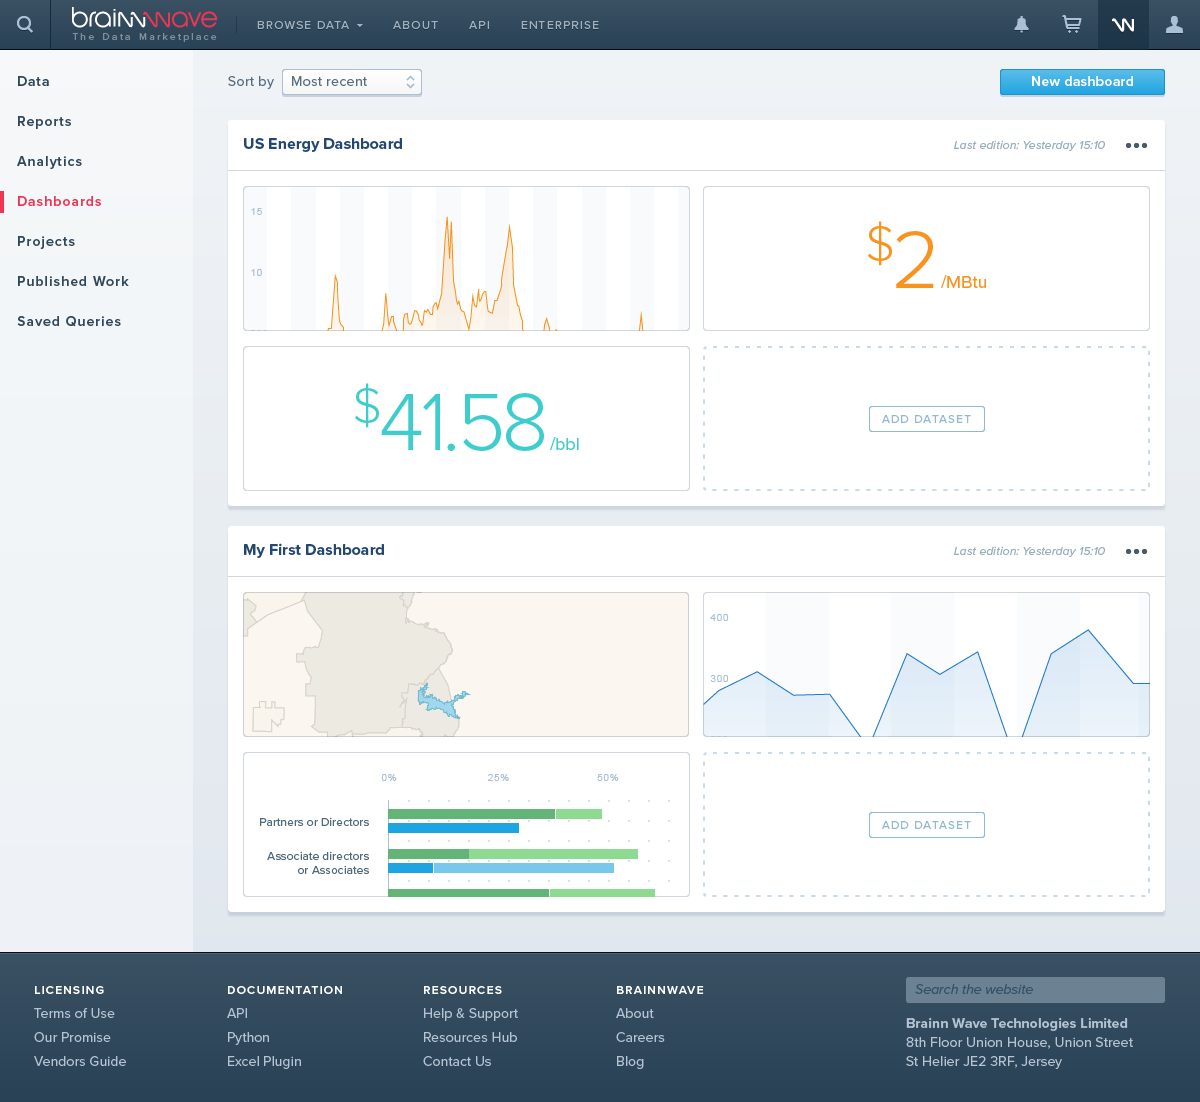
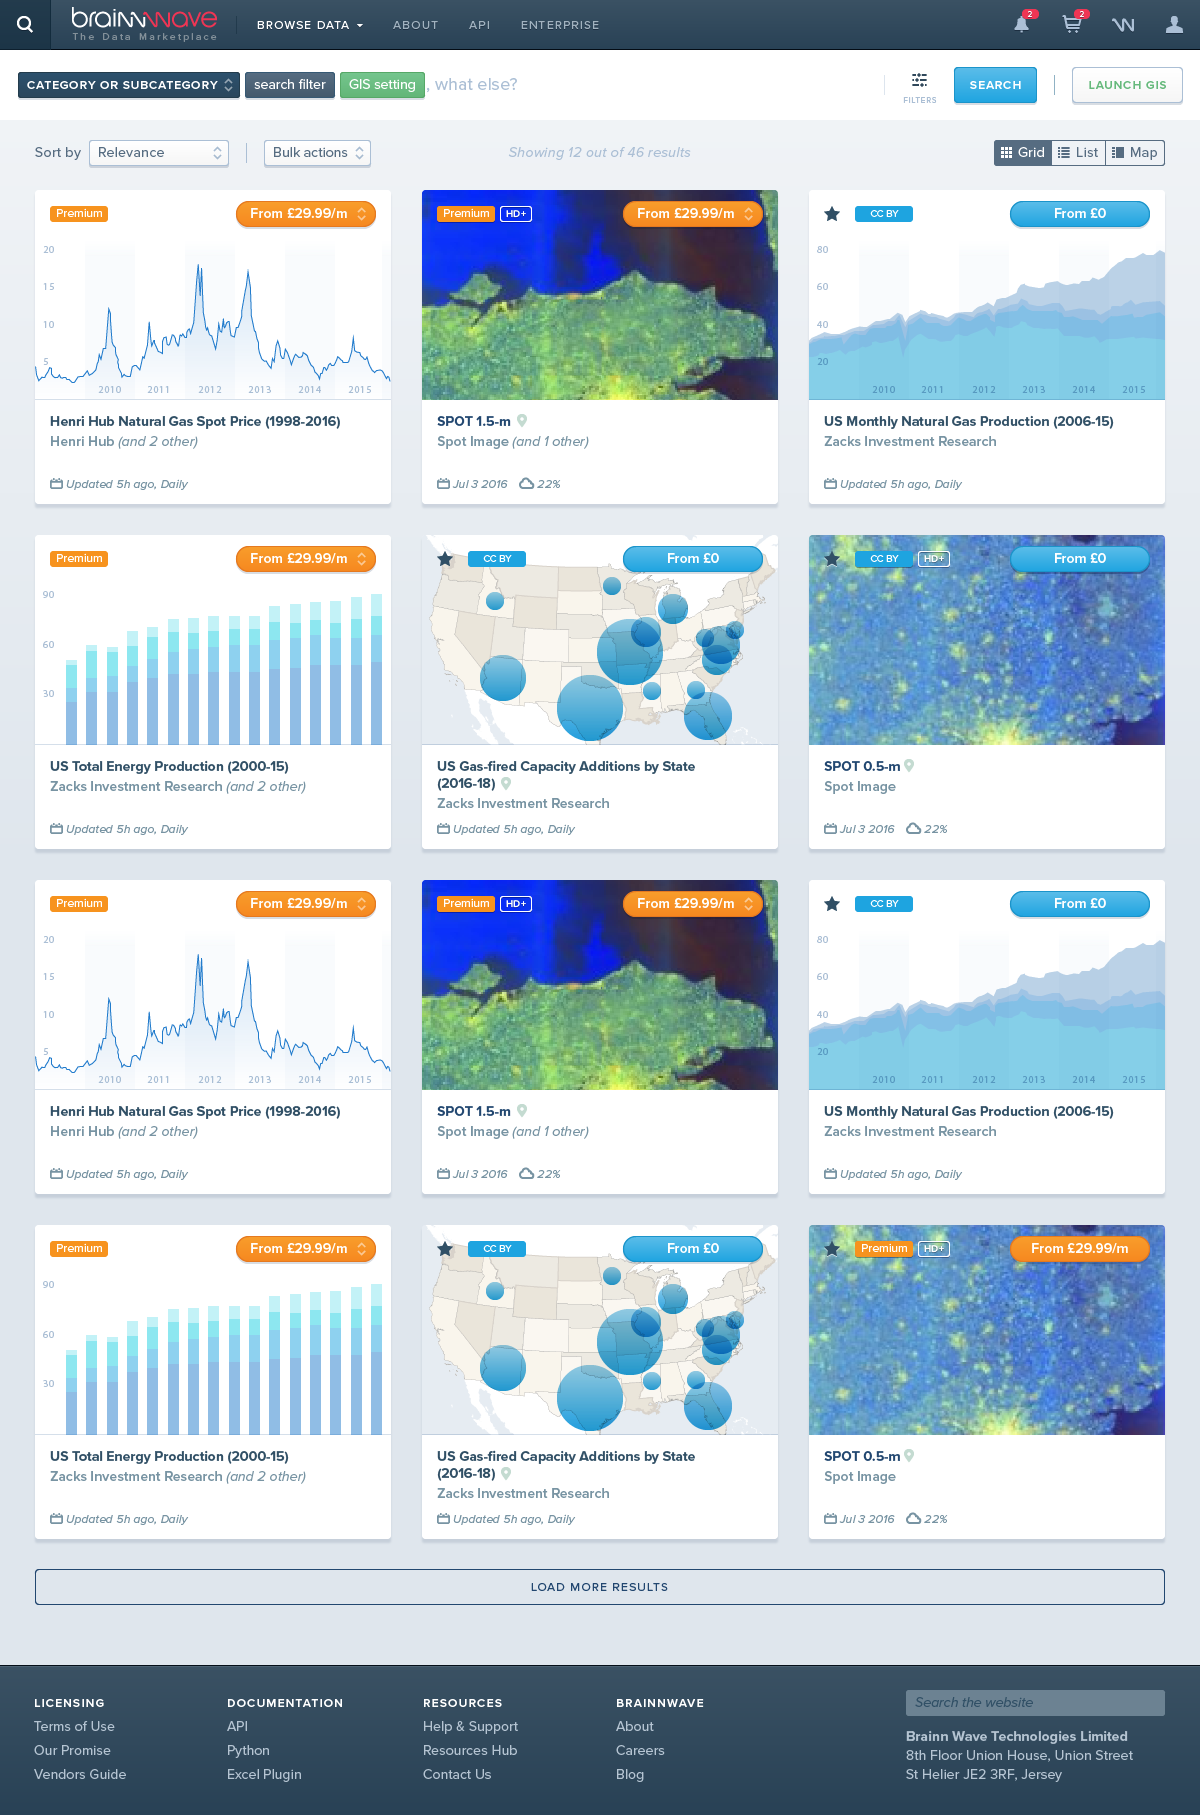
MARKETPLACE
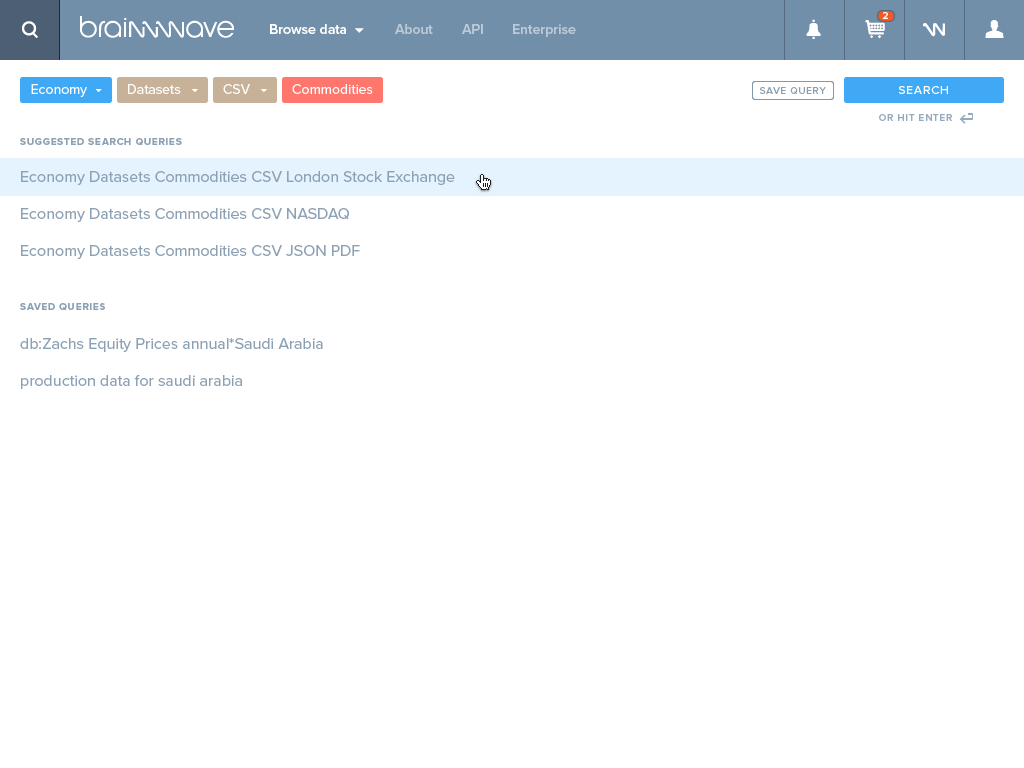
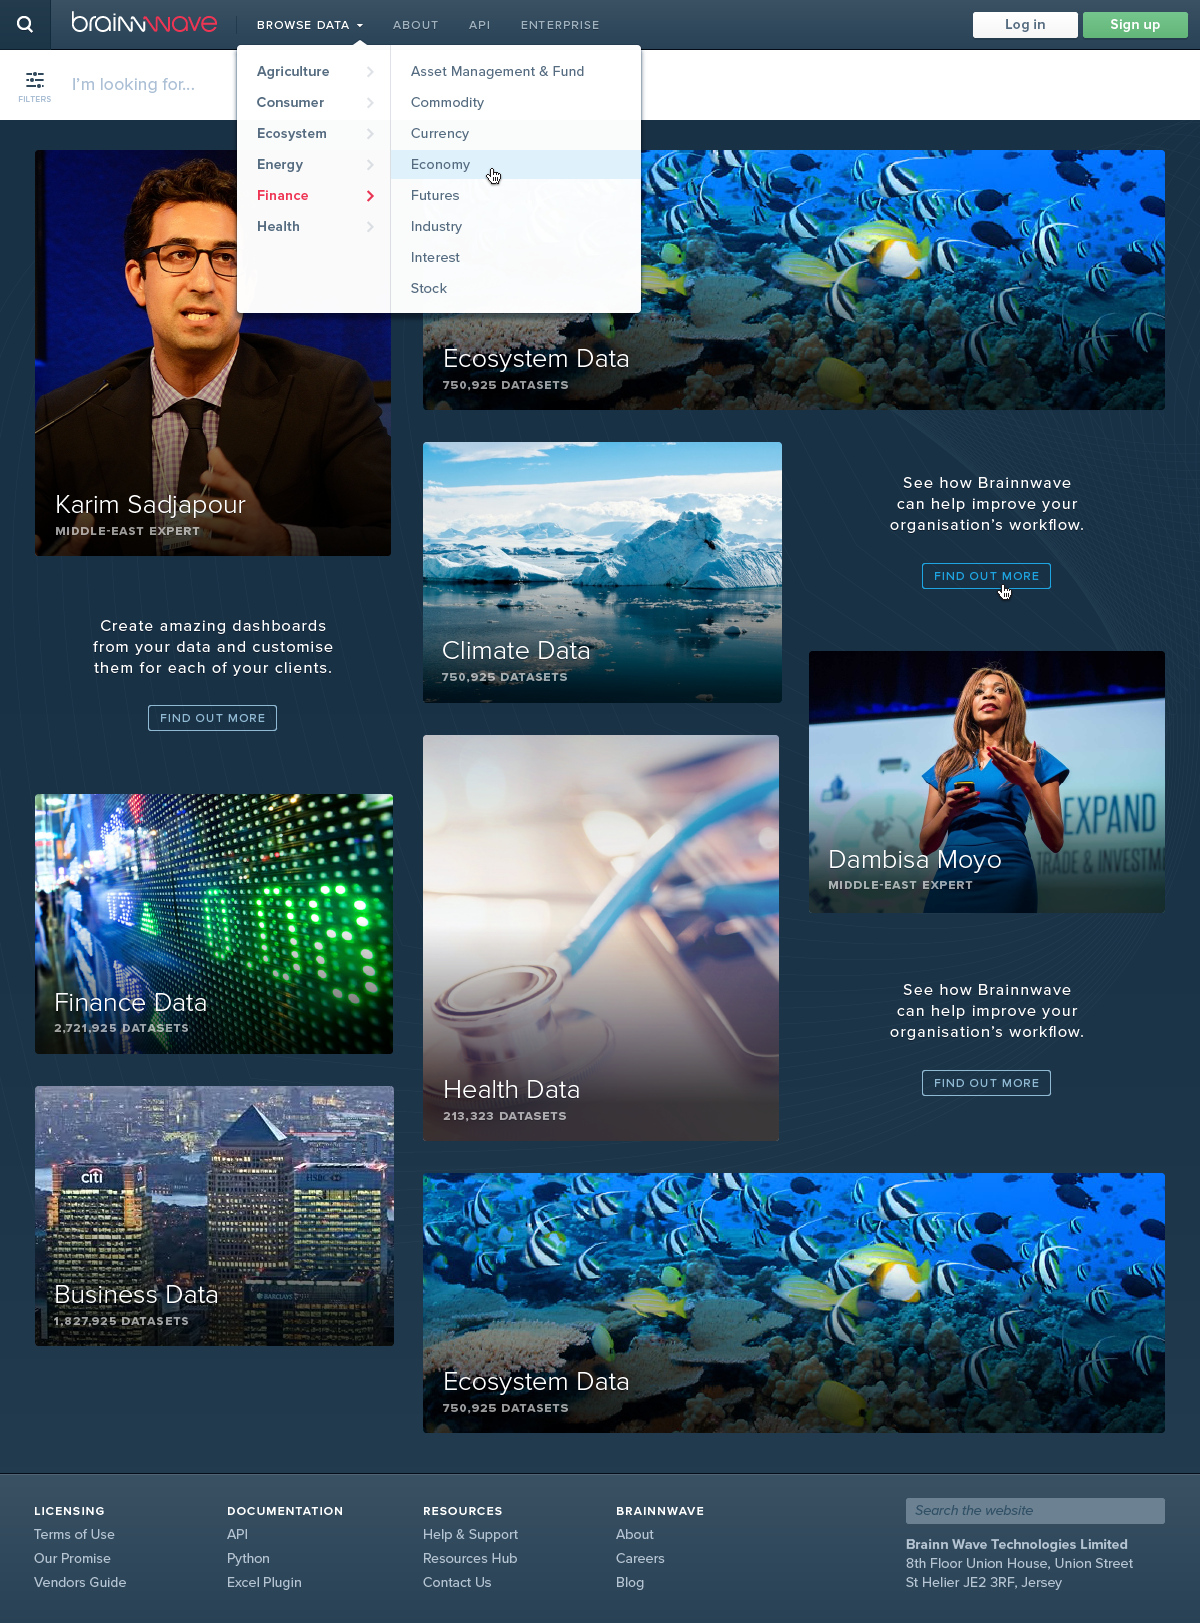
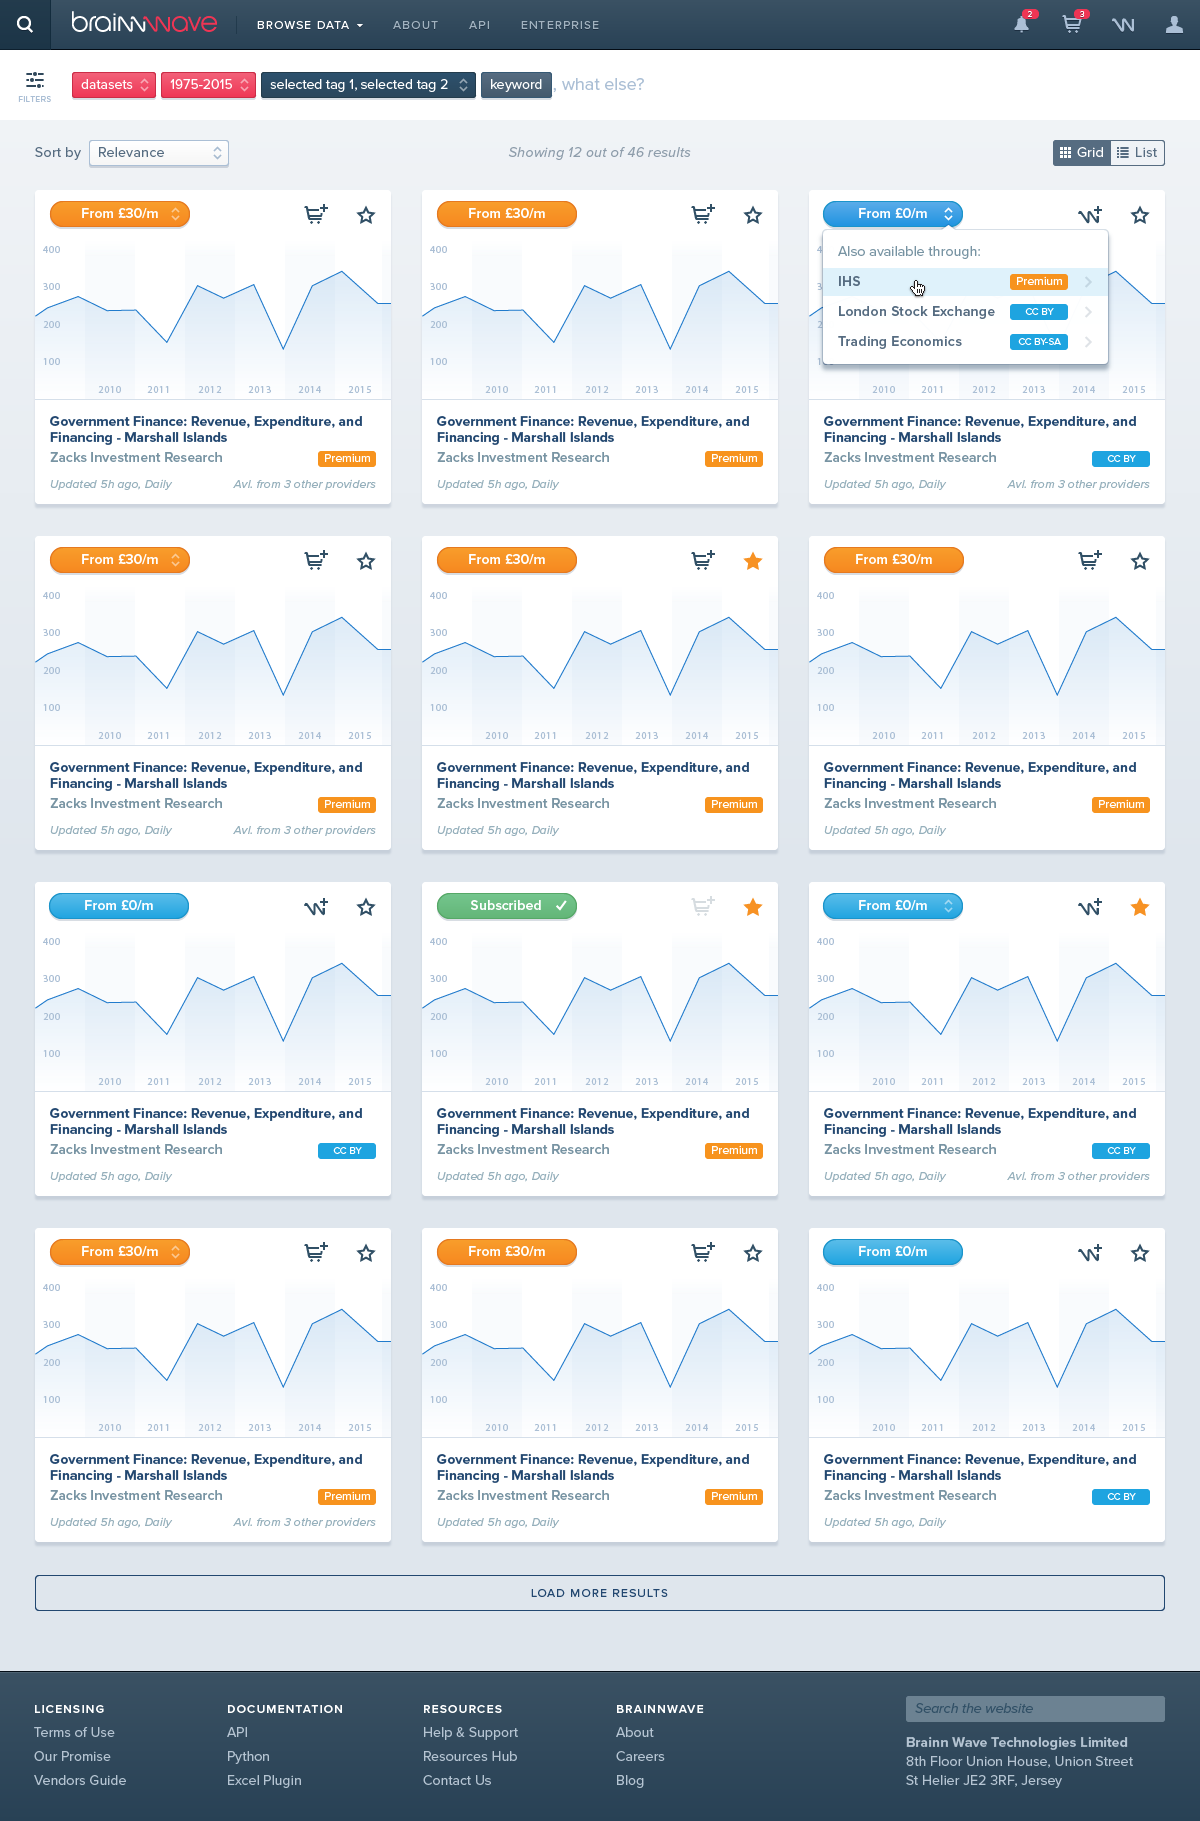
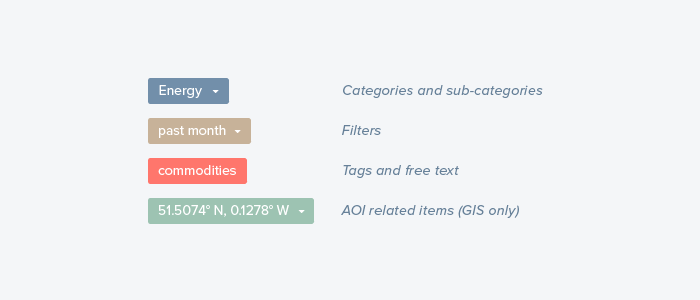
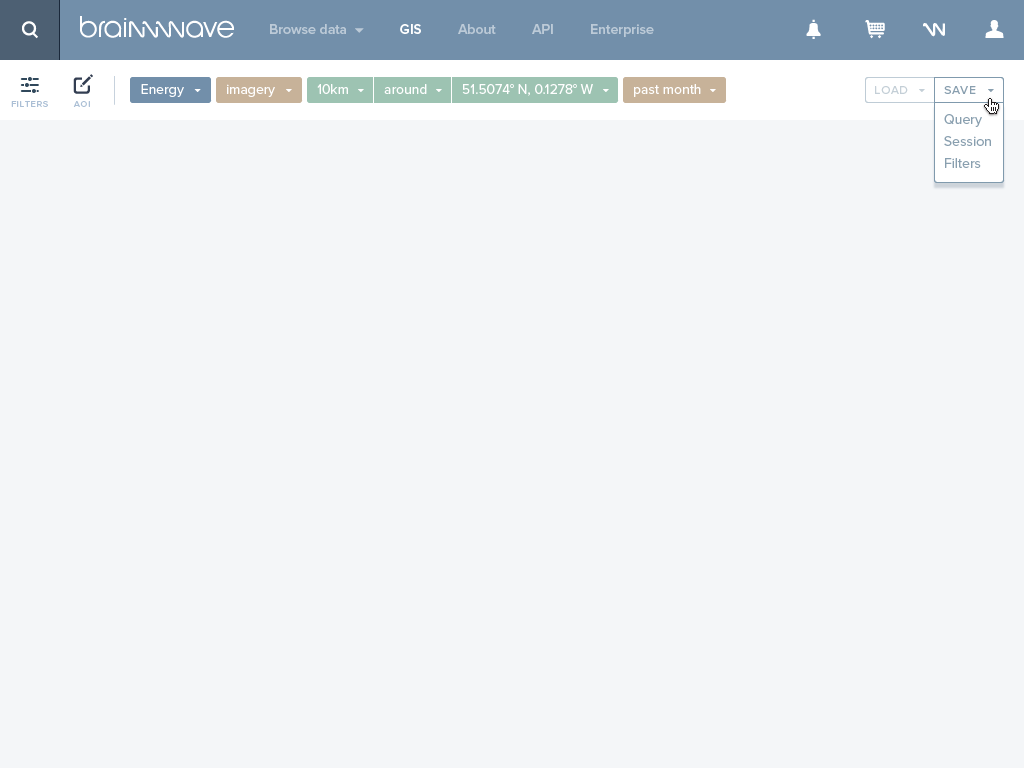
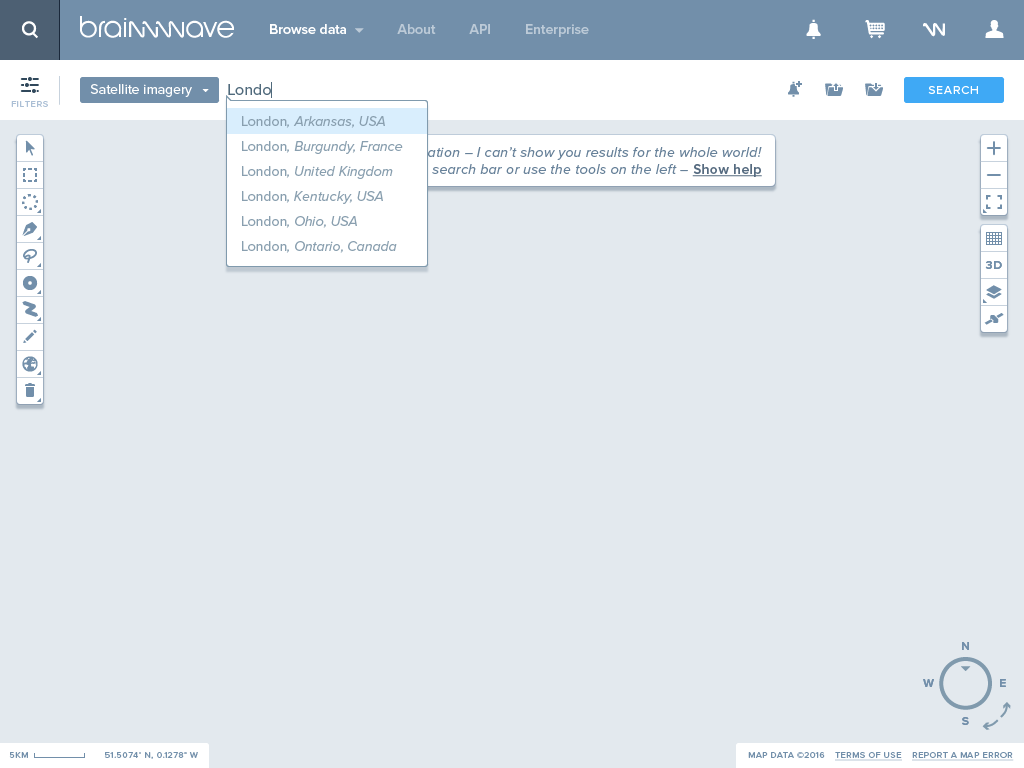
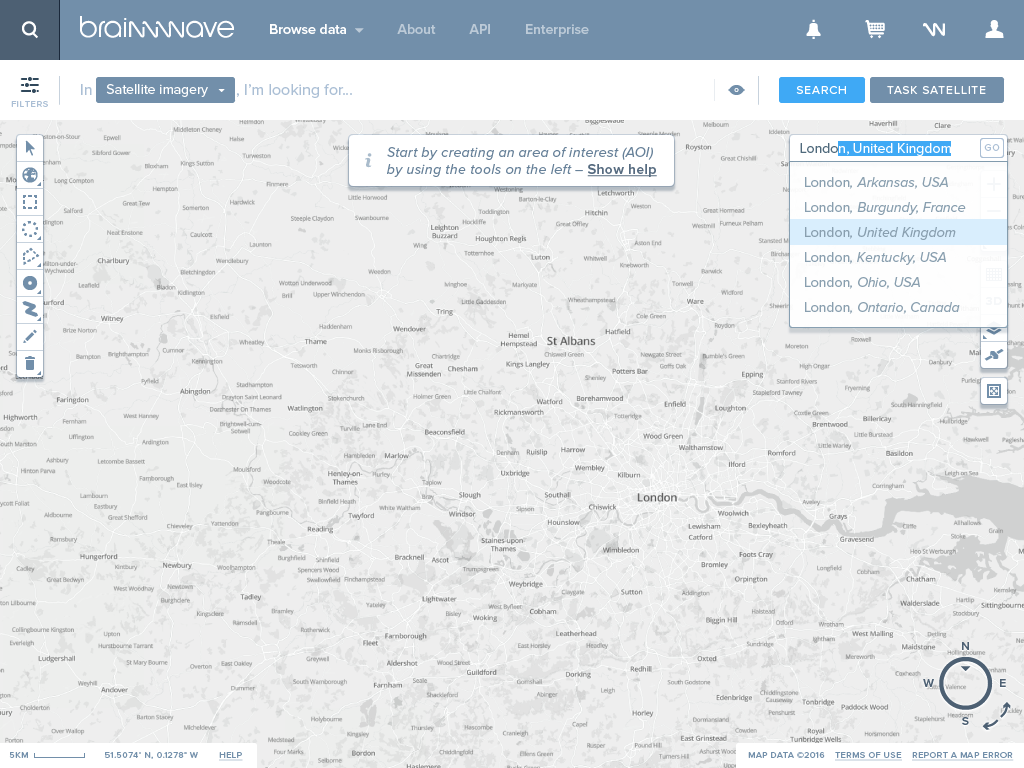
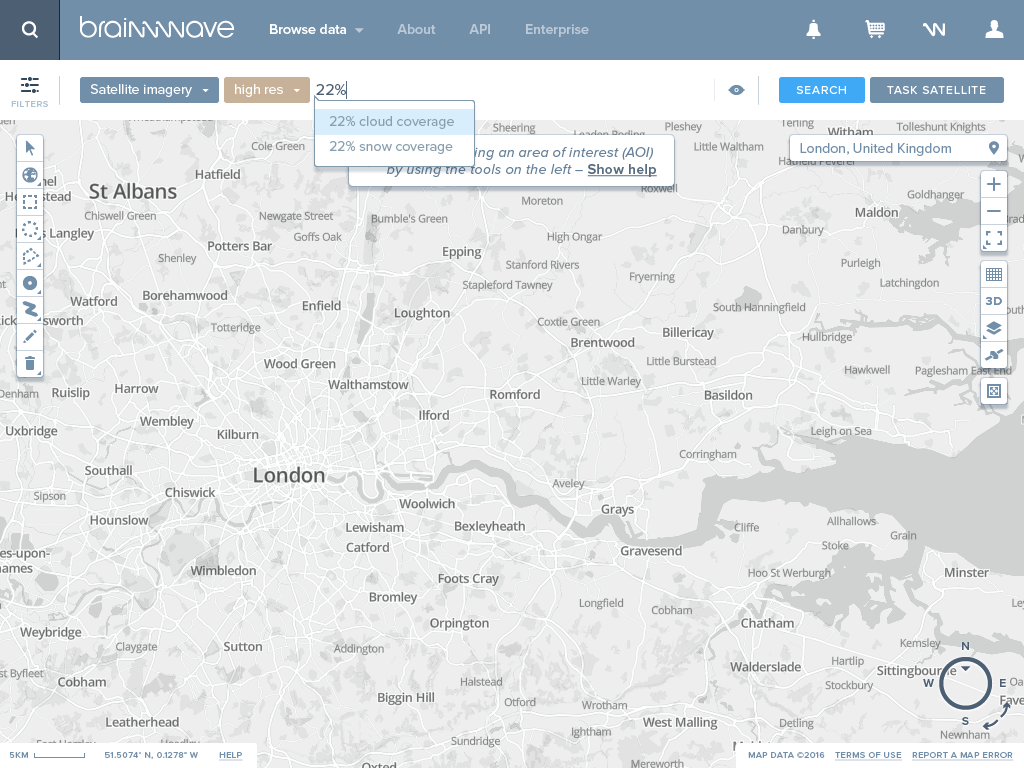
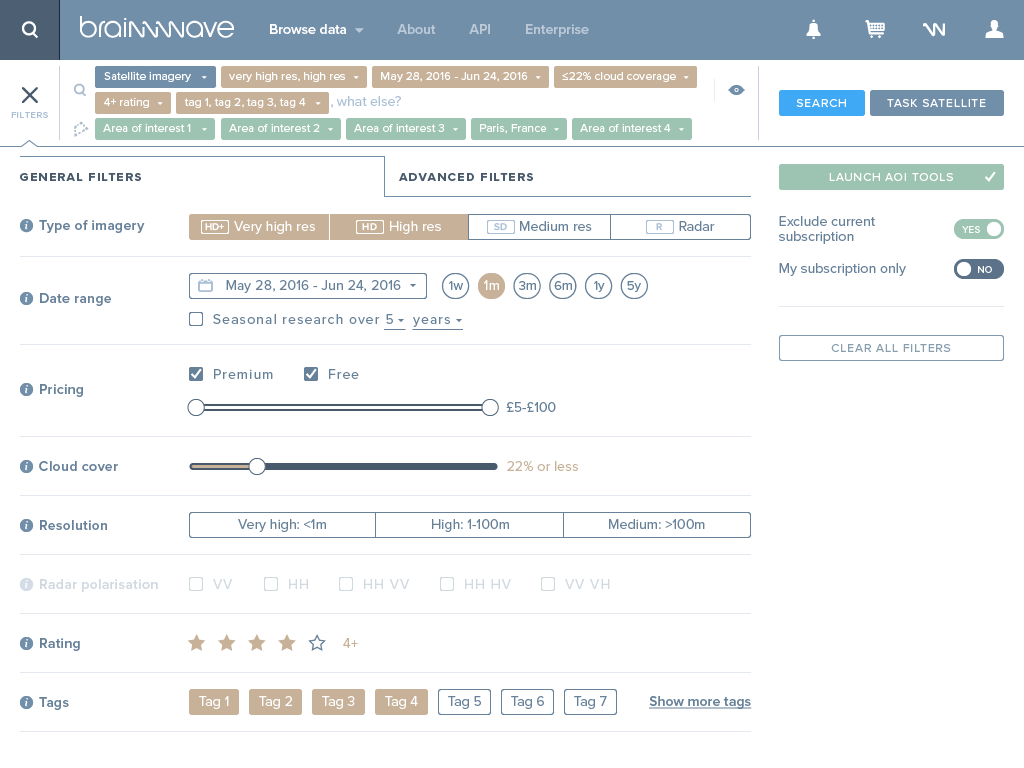
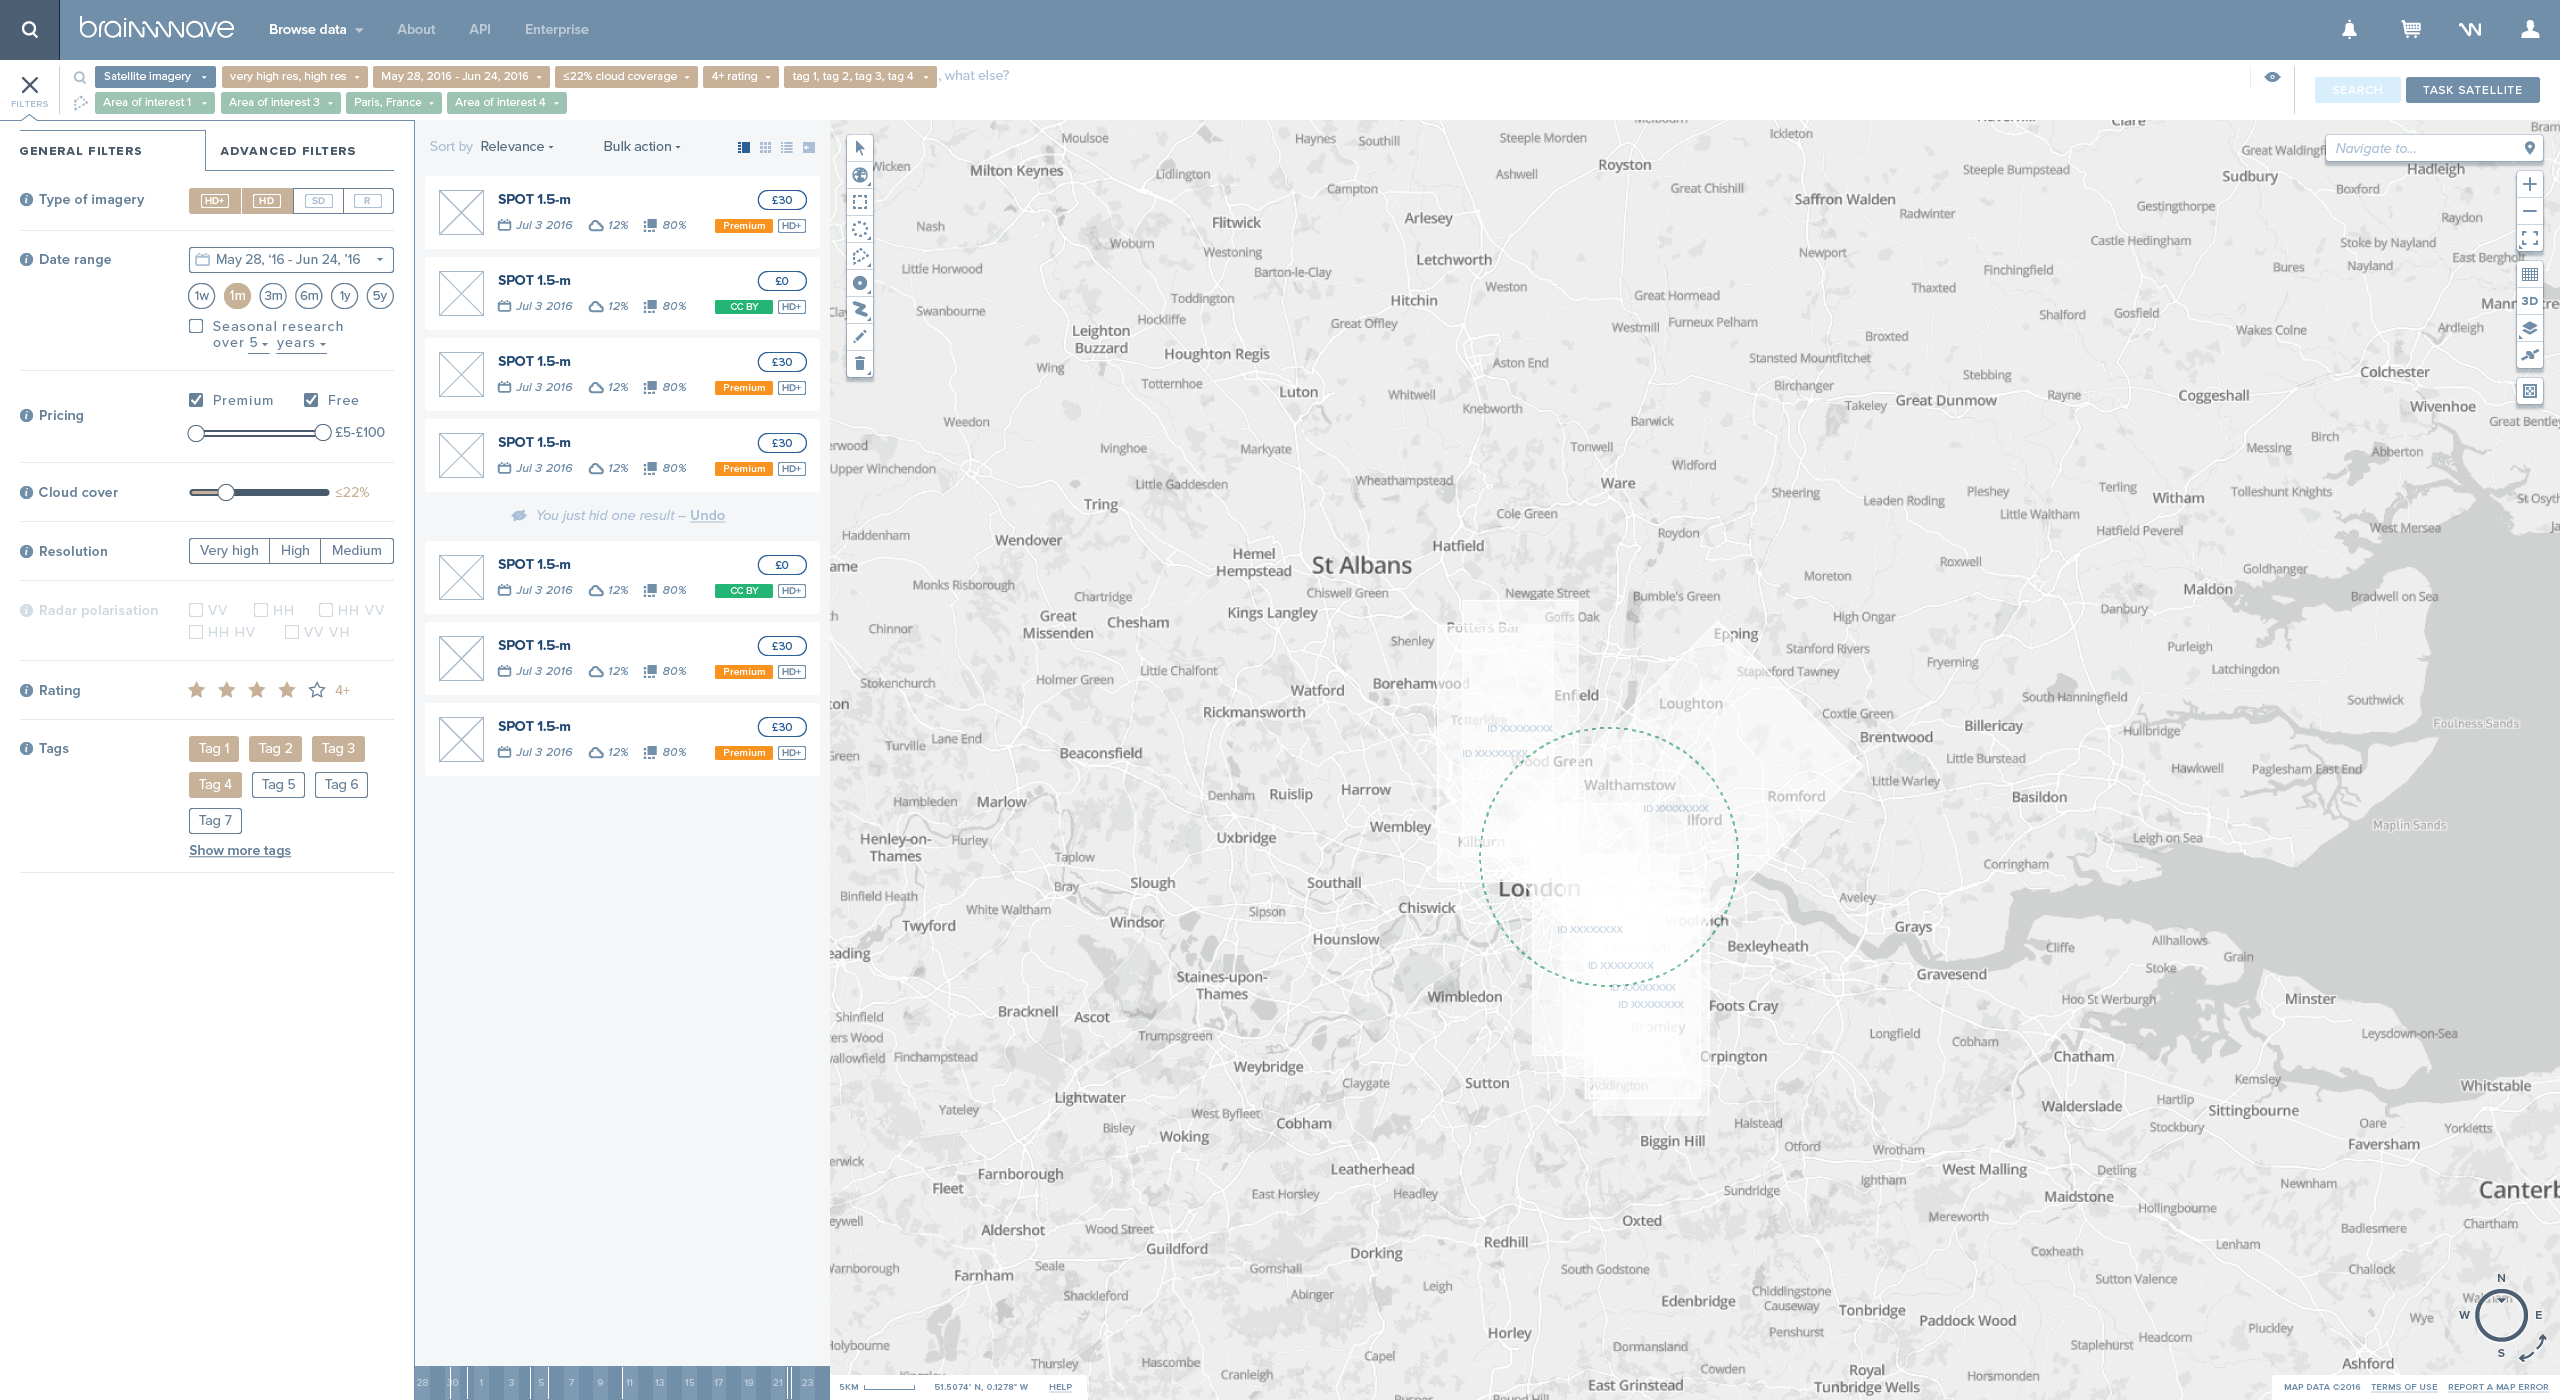
The shaping of the UX took many iterations to get it right. Really quickly we realised that we didn’t want users to interact with filters and dropdown menu to create their query. The user experience started to articulate itself quickly around a natural language input. We wanted users to simply type what they were looking for, while also offering enough room for intricate, granular, options.
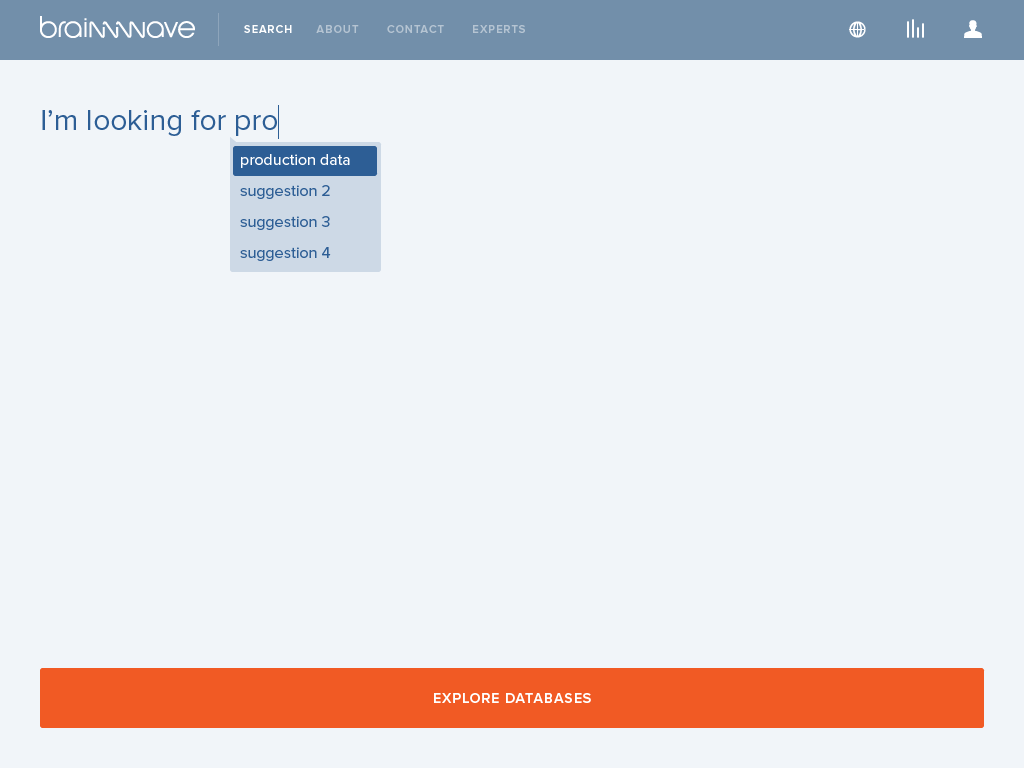
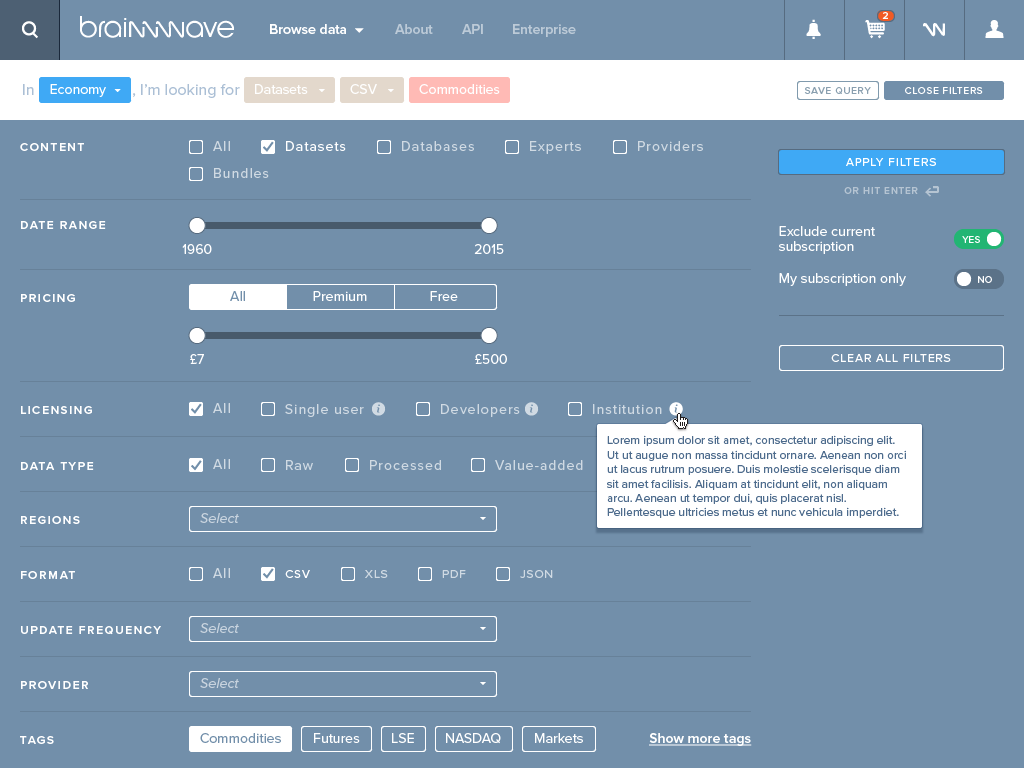
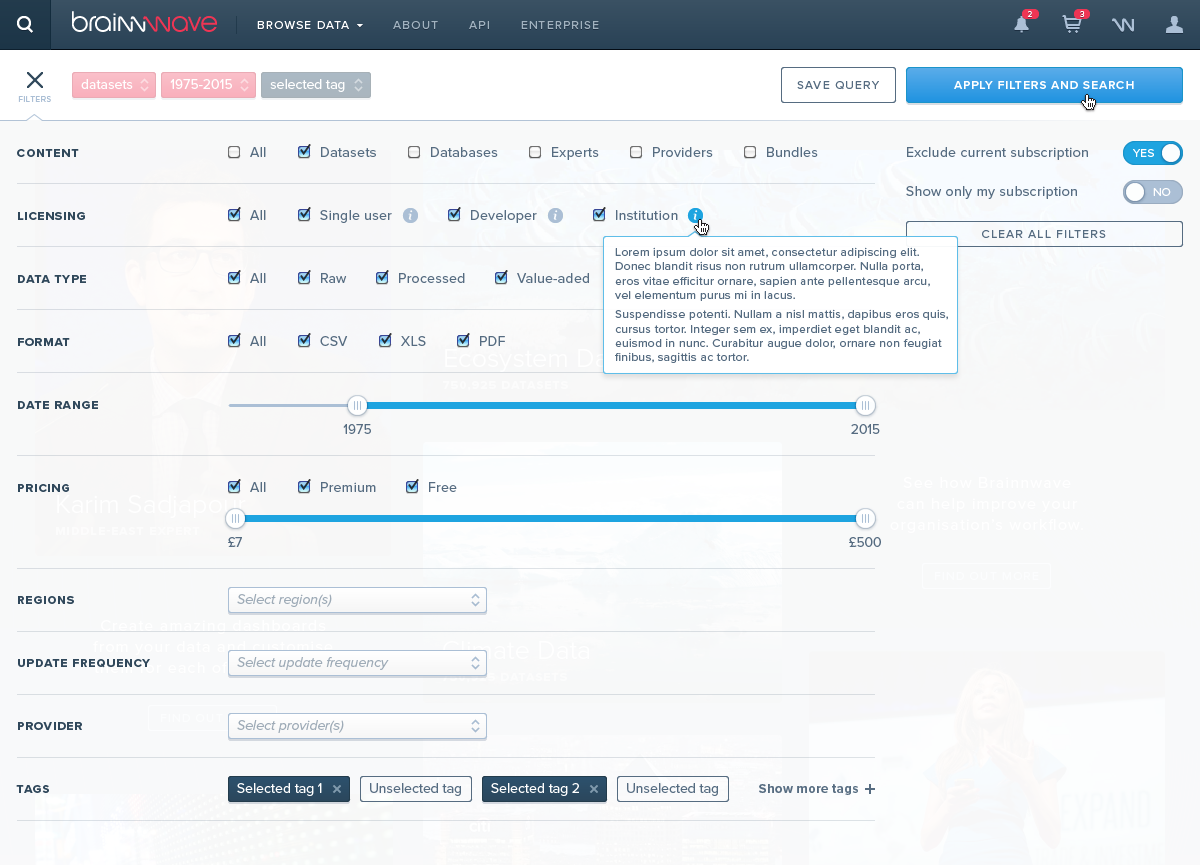
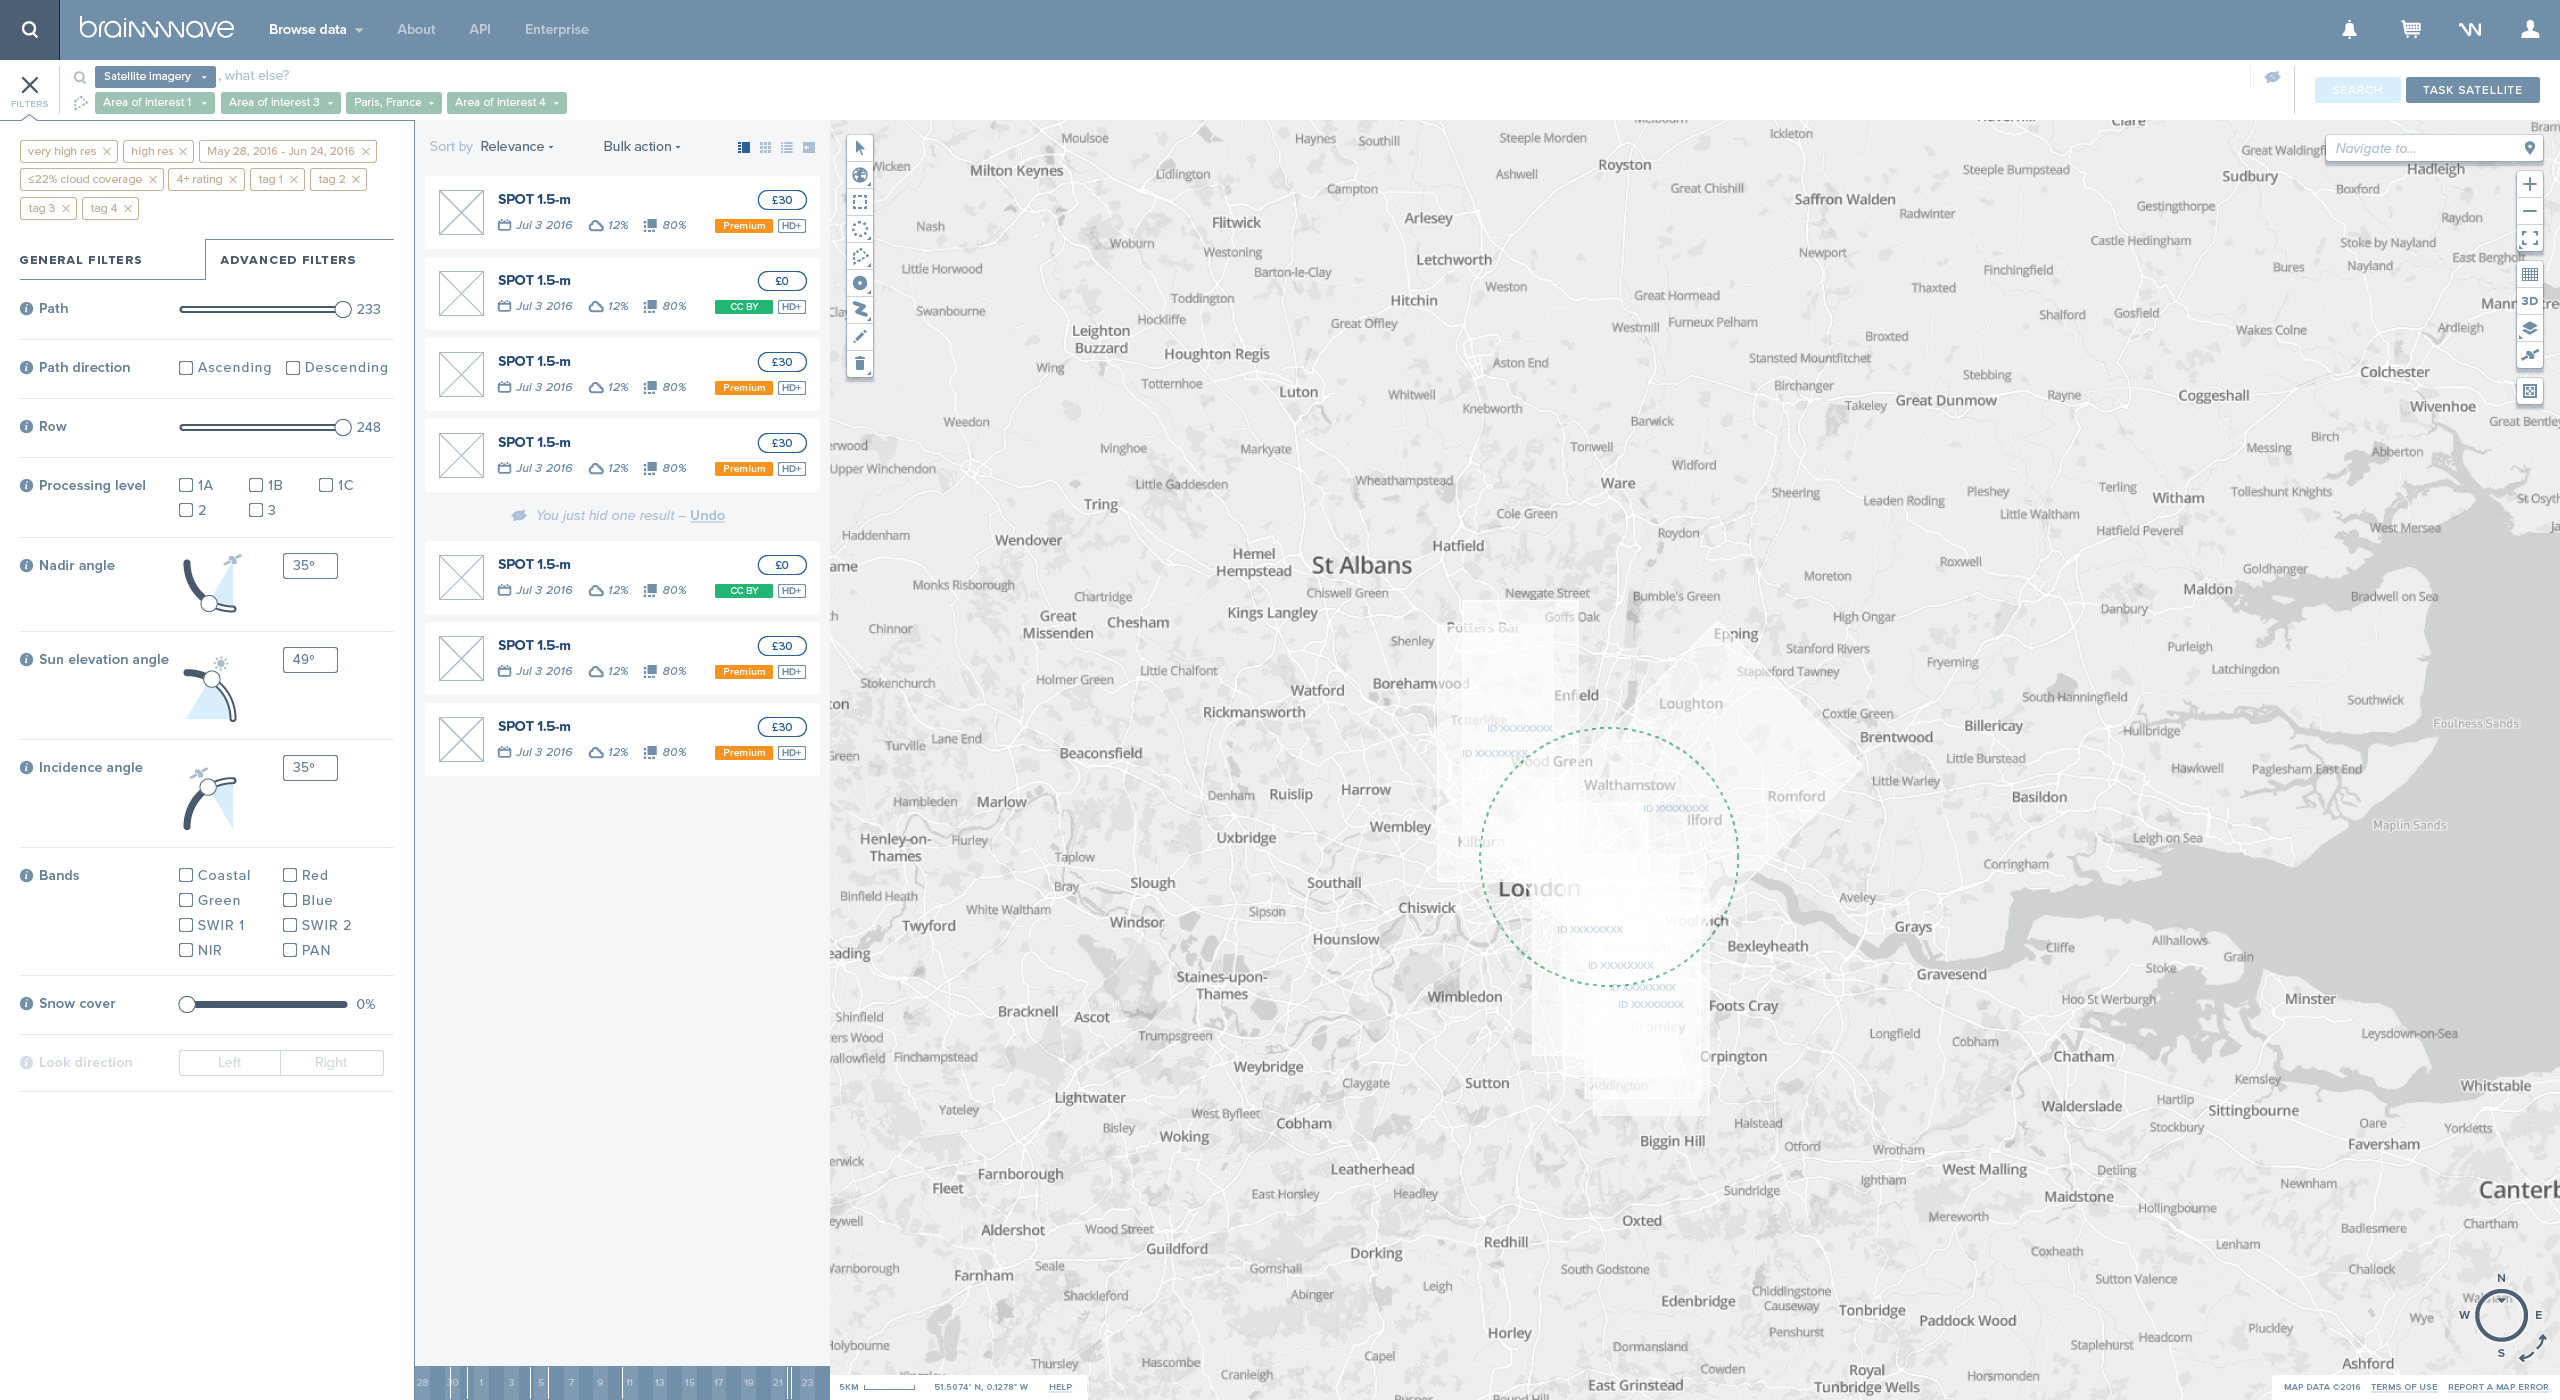
We experimented with different look-and-feel for the query builder, how colours could signify different categories of filters and/or data, how the words typed in the input field would combine with a filter menu, which quickly became necessary given the sheer volume and different data types. It was also a given that, if expert users would be able to effortlessly type in efficient and intricate queries, new users would struggle to appreciate the full scope of metadata they can use to filter the marketplace without a good old filter panel…
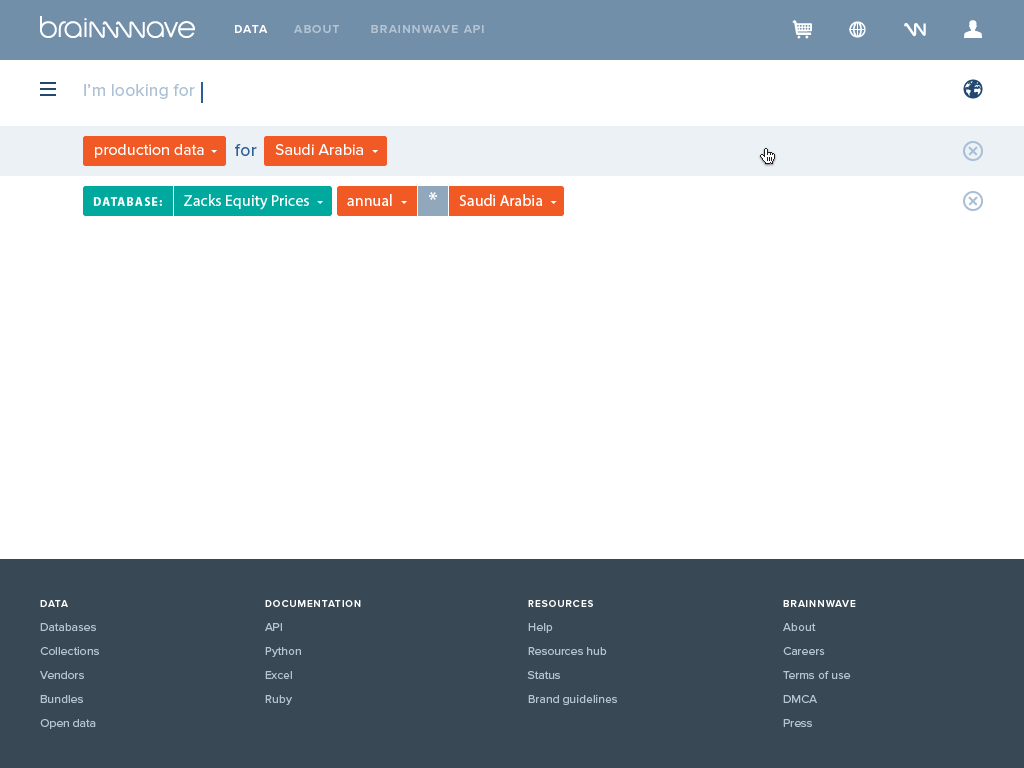
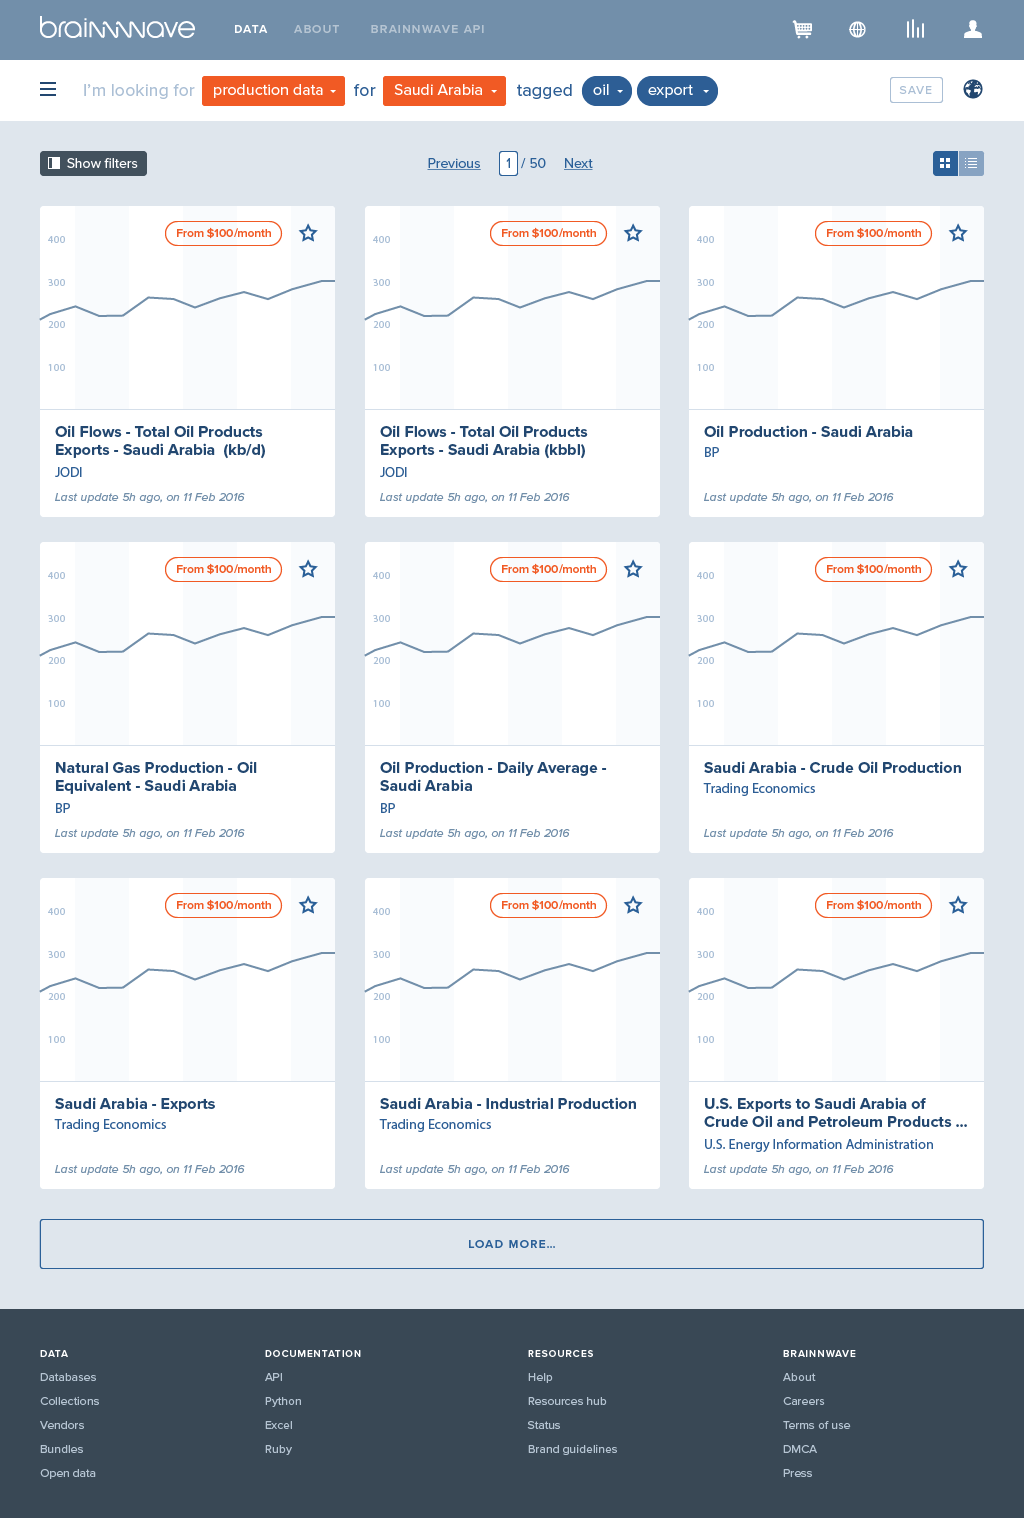
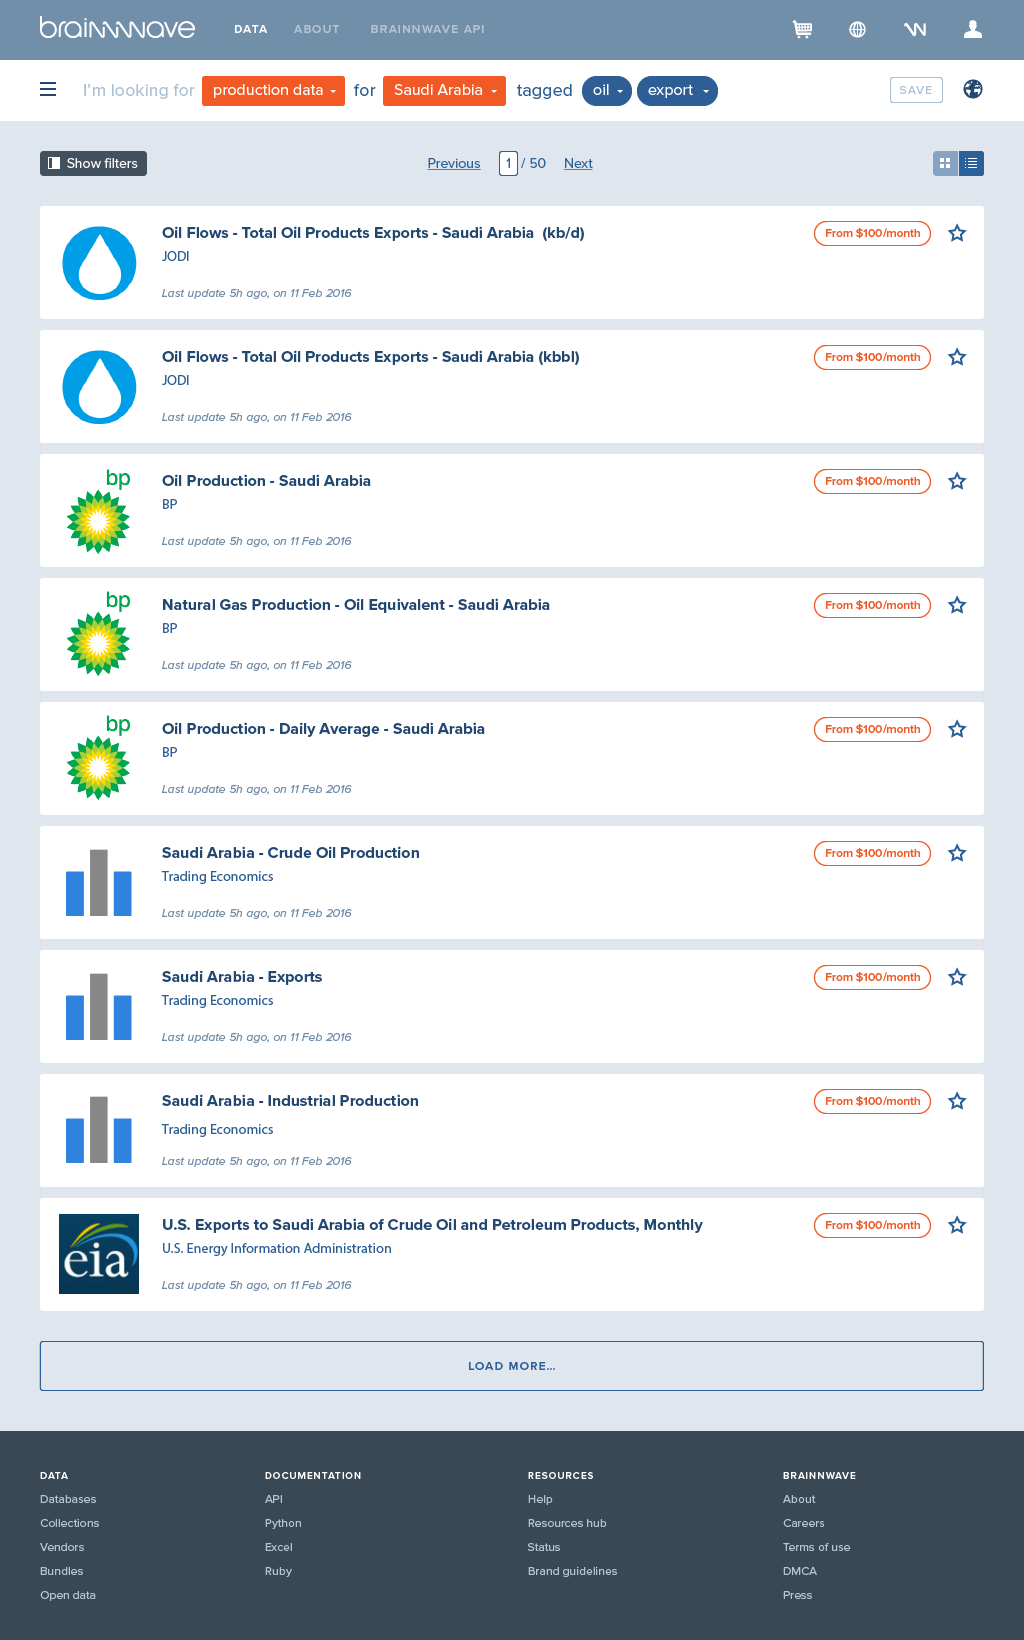
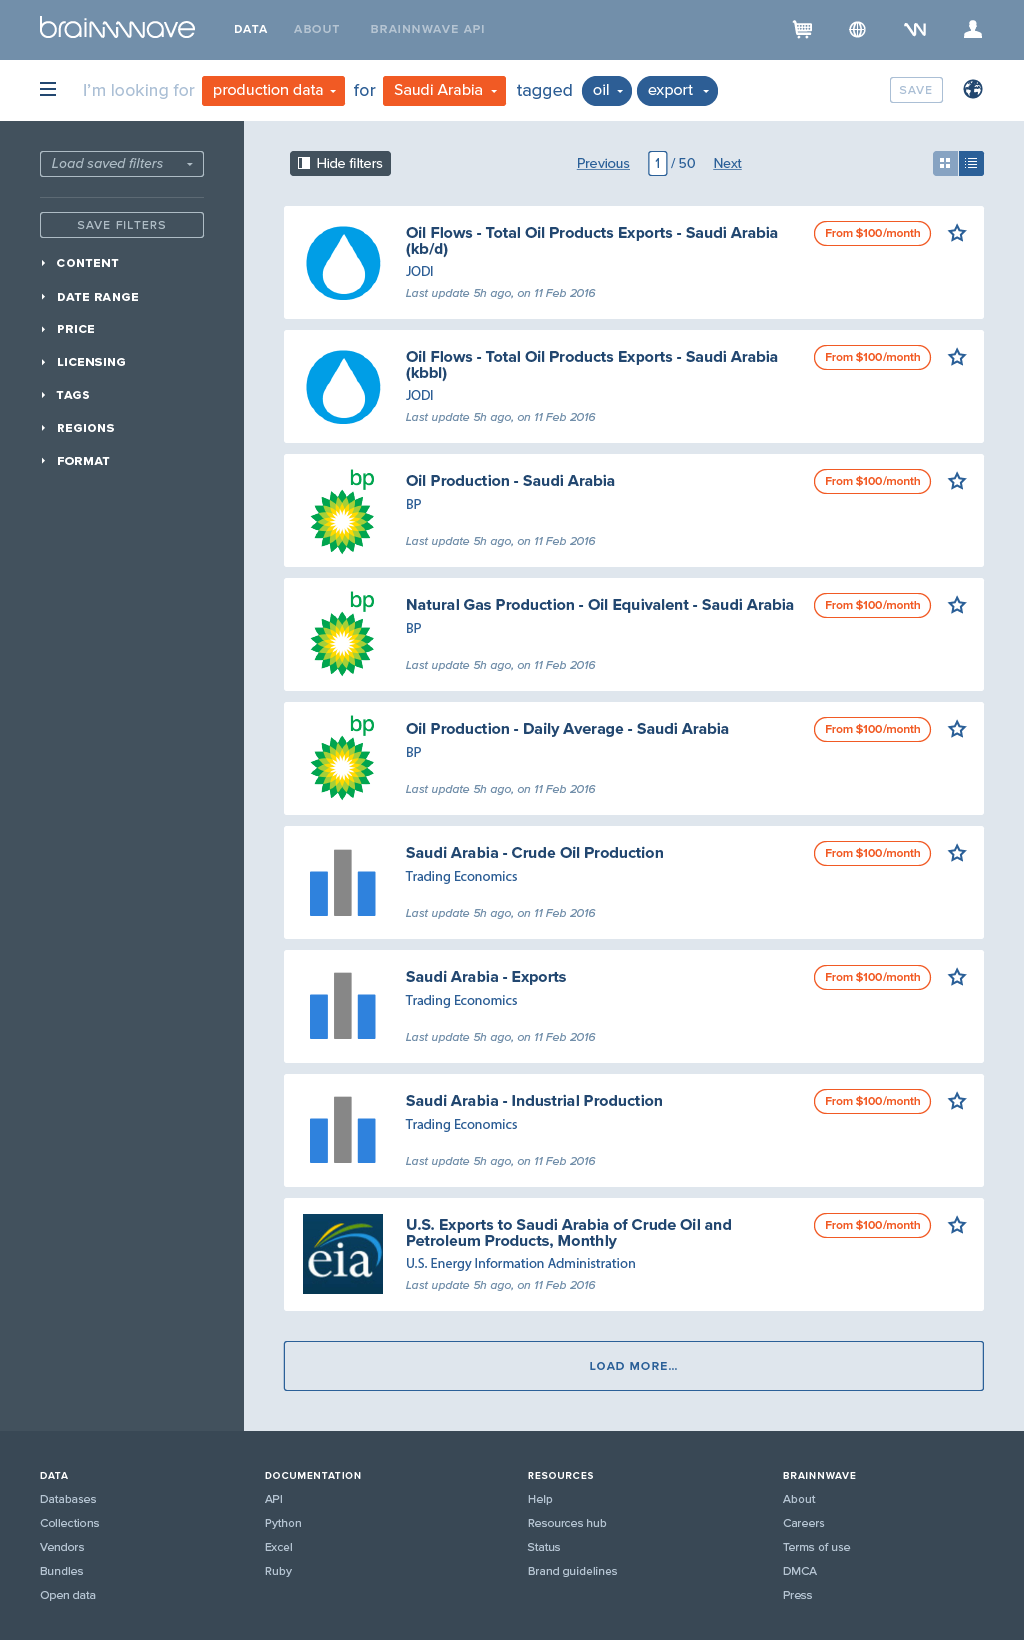
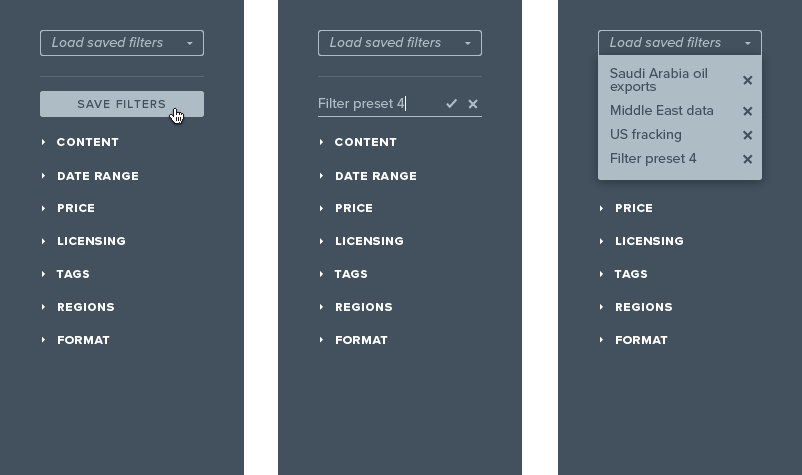
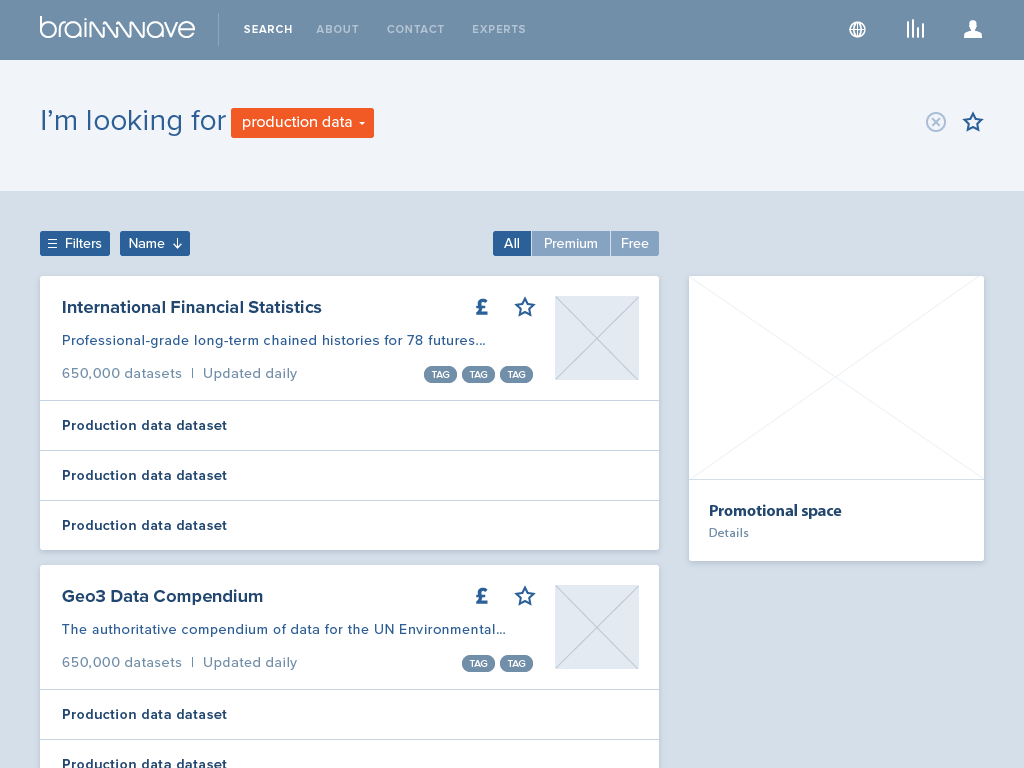
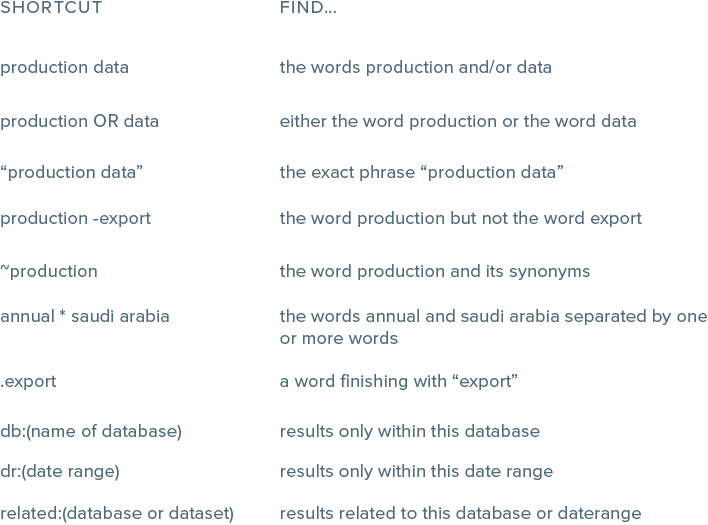
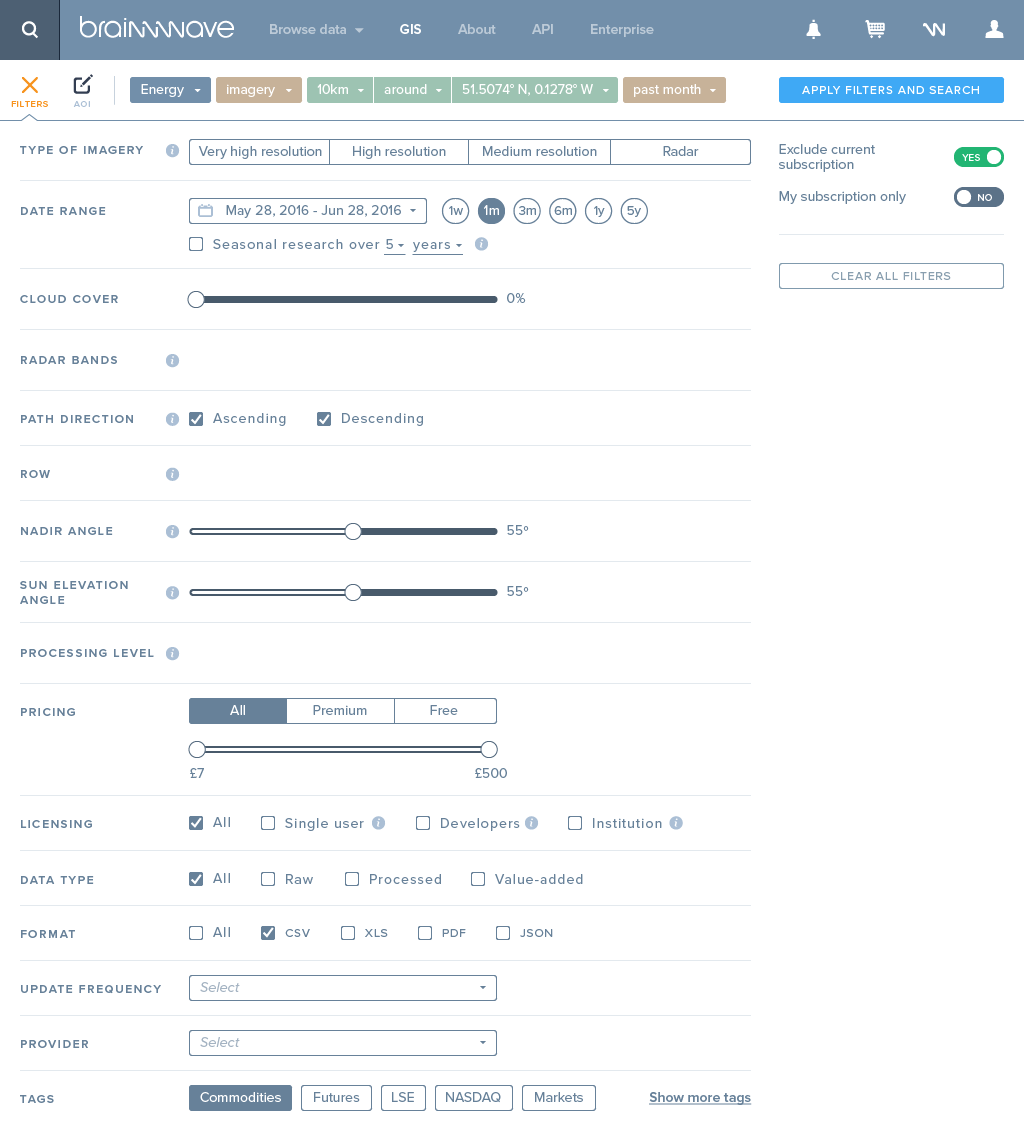
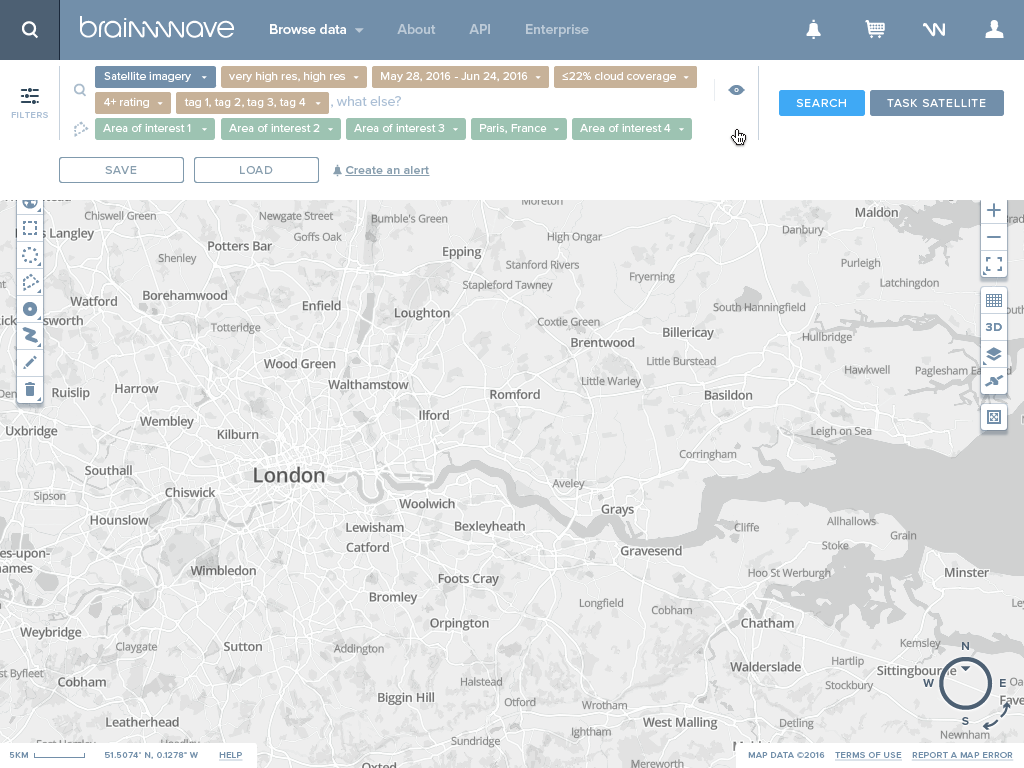
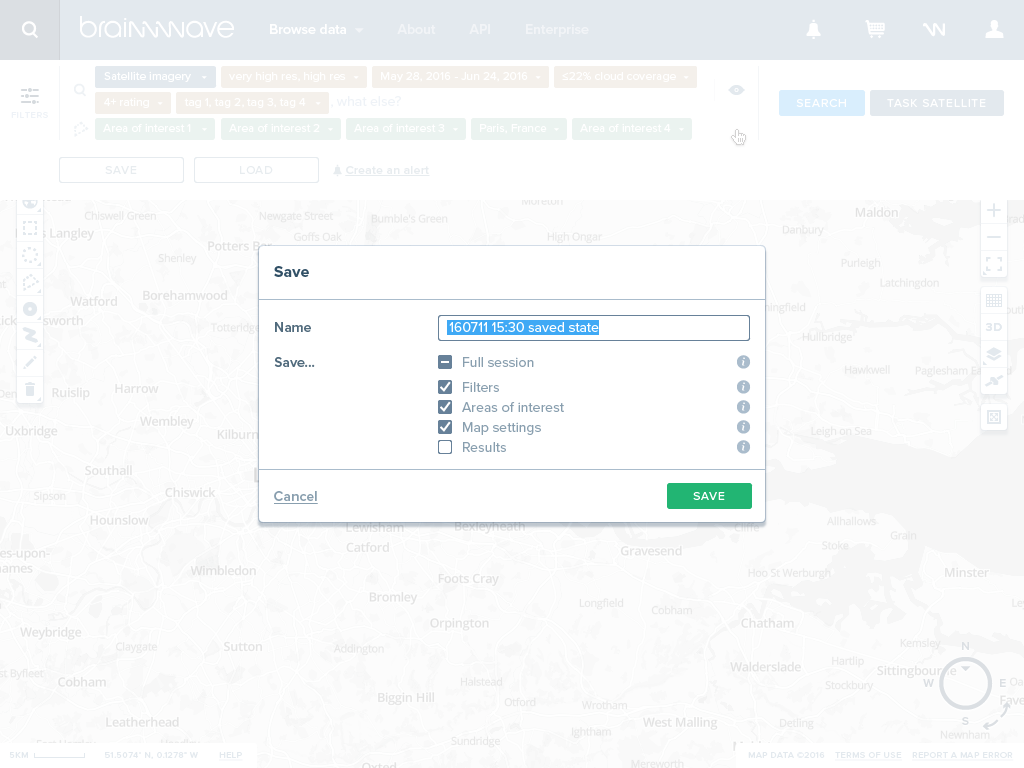
We settled with “combining” the query input field and the filter panel, having them geographically close together on the screen, and complementing each other. So an expert user would just type what he’s looking after (while turning on certain filters in the backgroud), while a new user can easily access a filter panel with all options laid out which, upon selecting them, would build the query in real time. We thought it would be a pretty elegant way to teach new users how to use the marketplace more efficiently. We also worked on shortcuts based on search engines’ ones, to make the experience even faster while being easy to grasp.
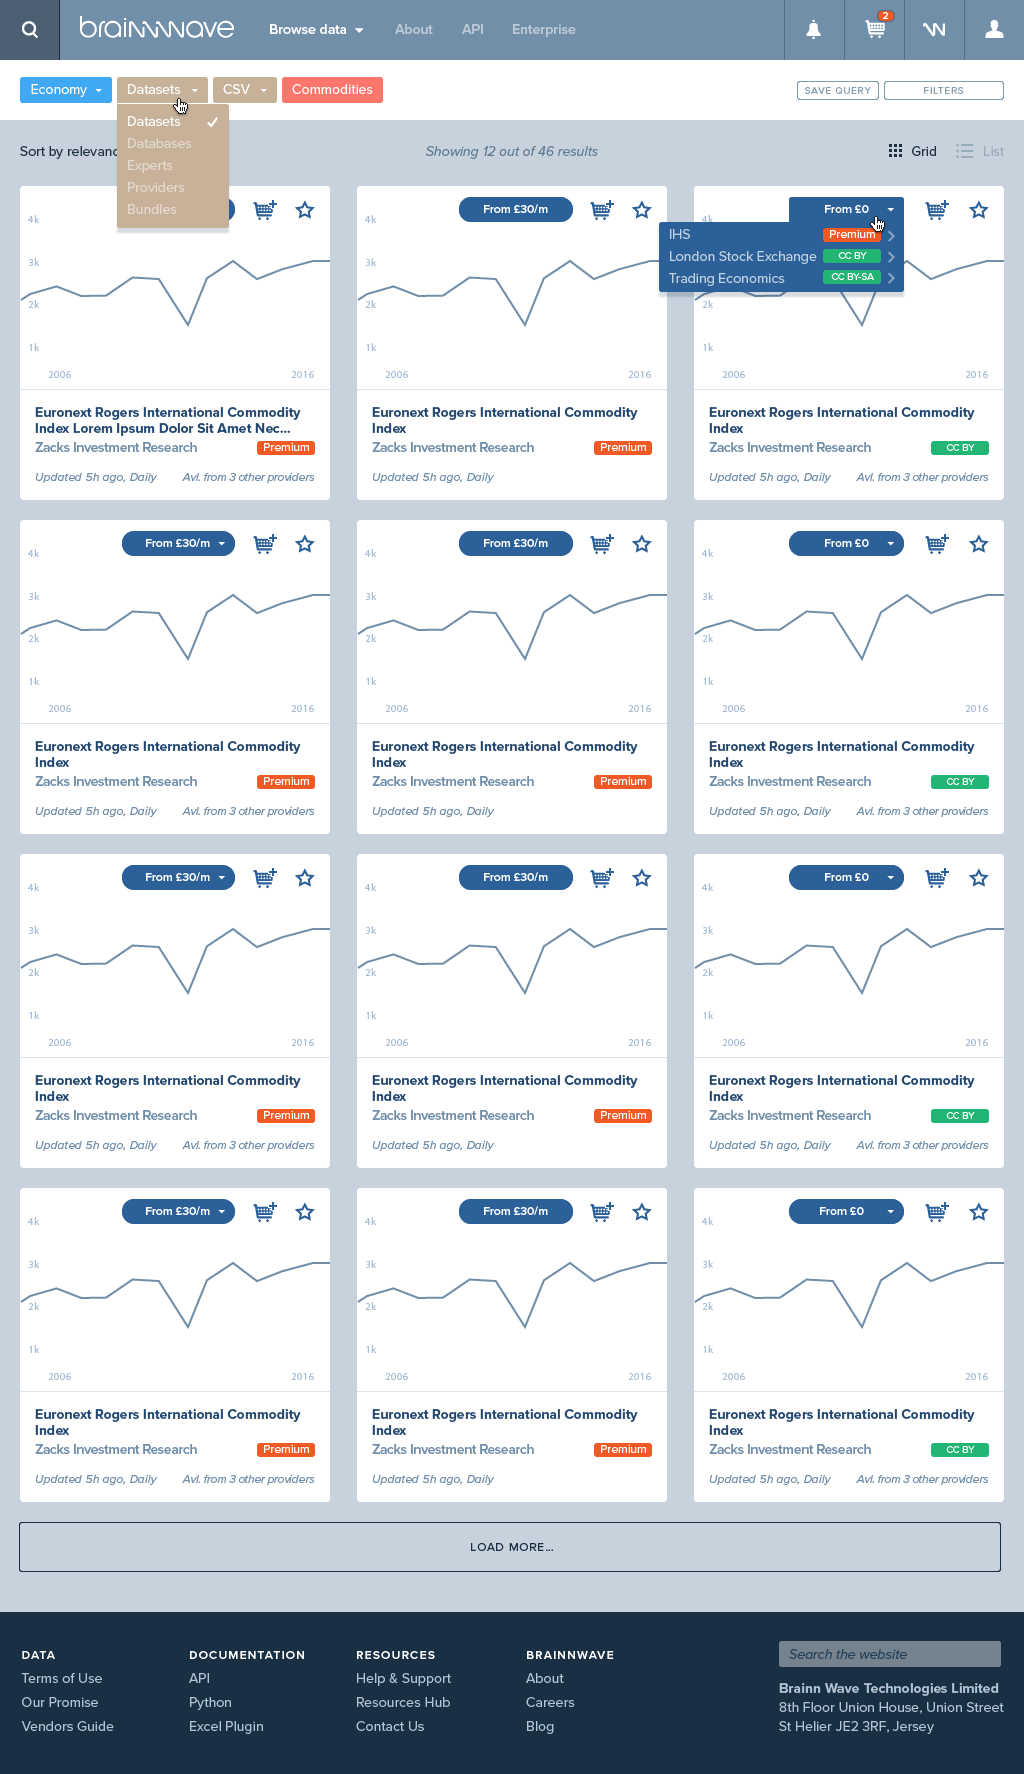
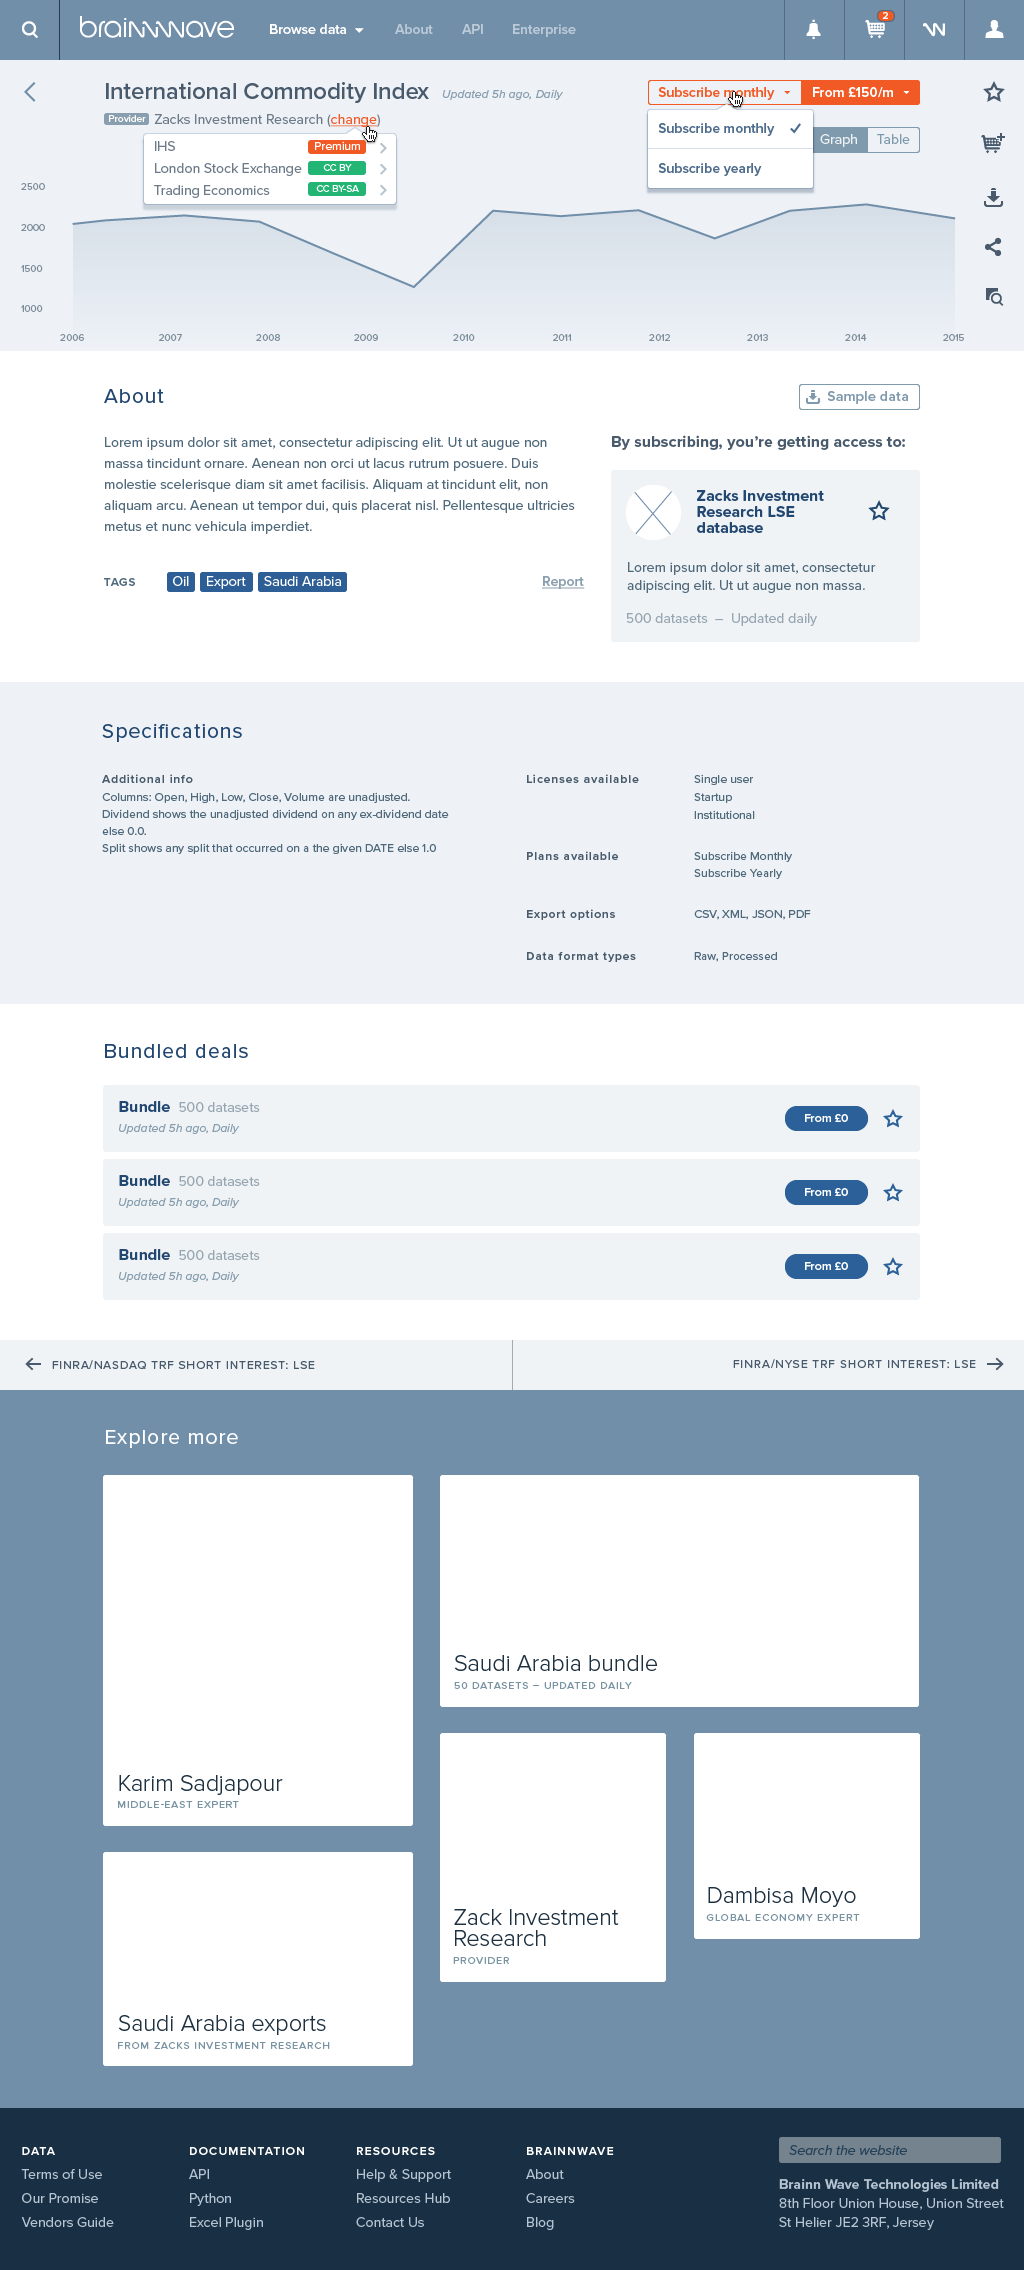
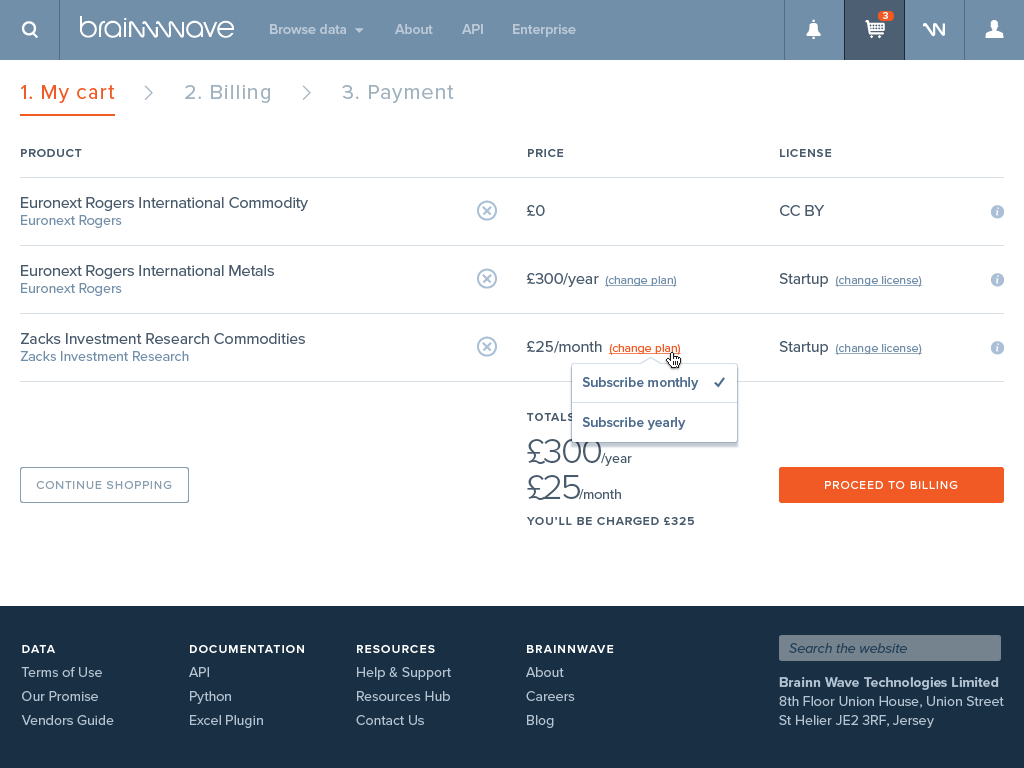
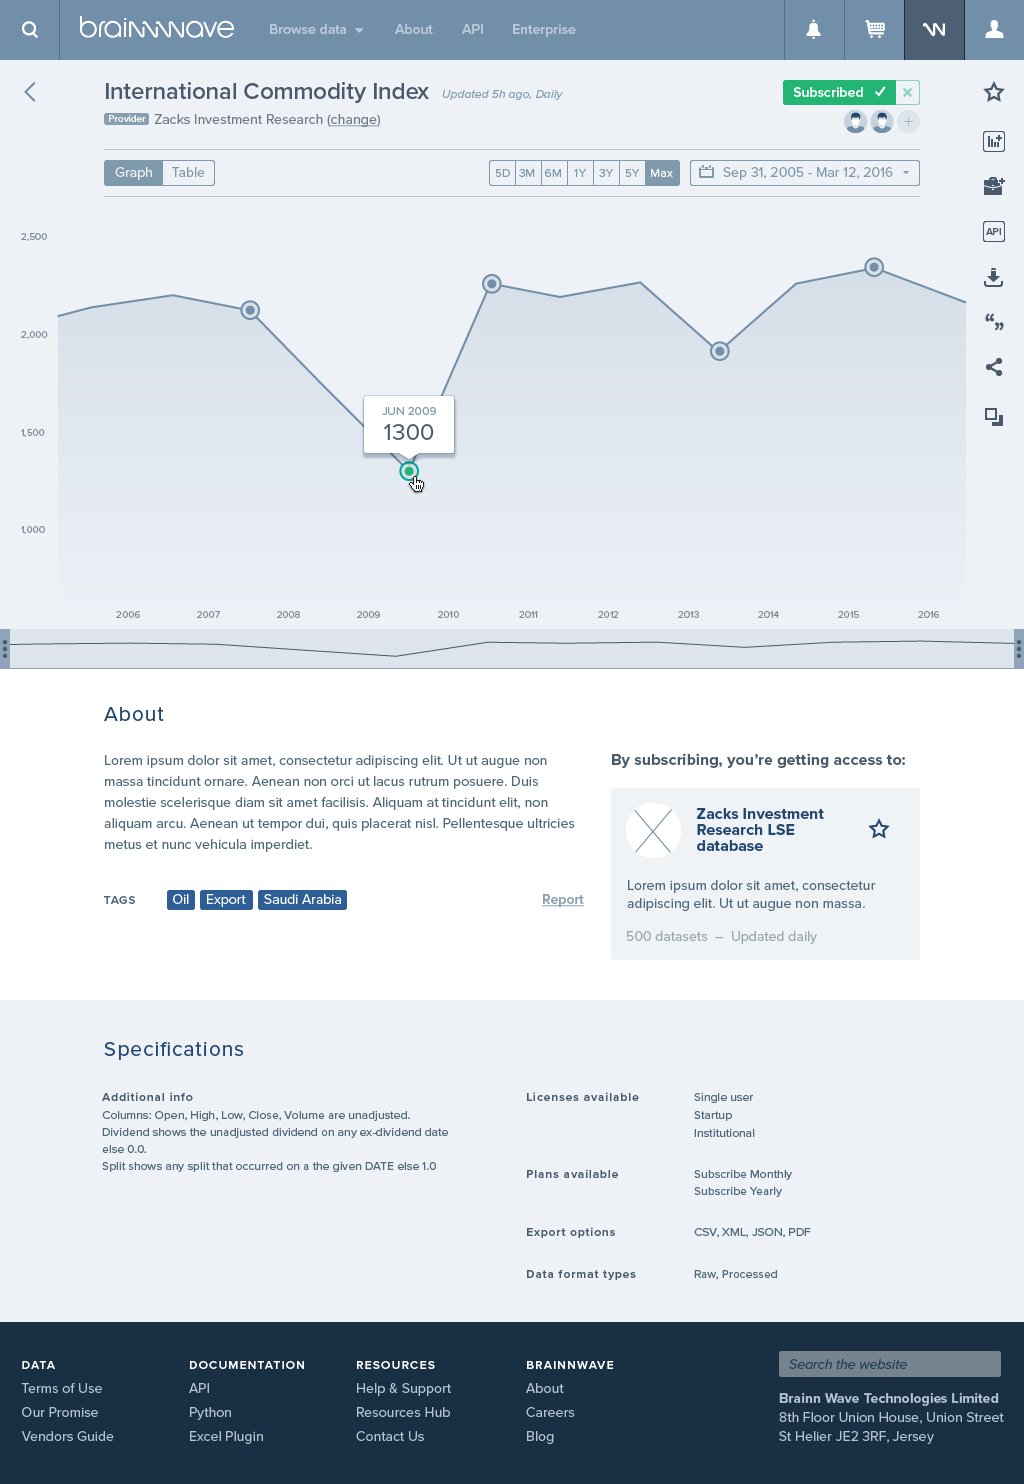
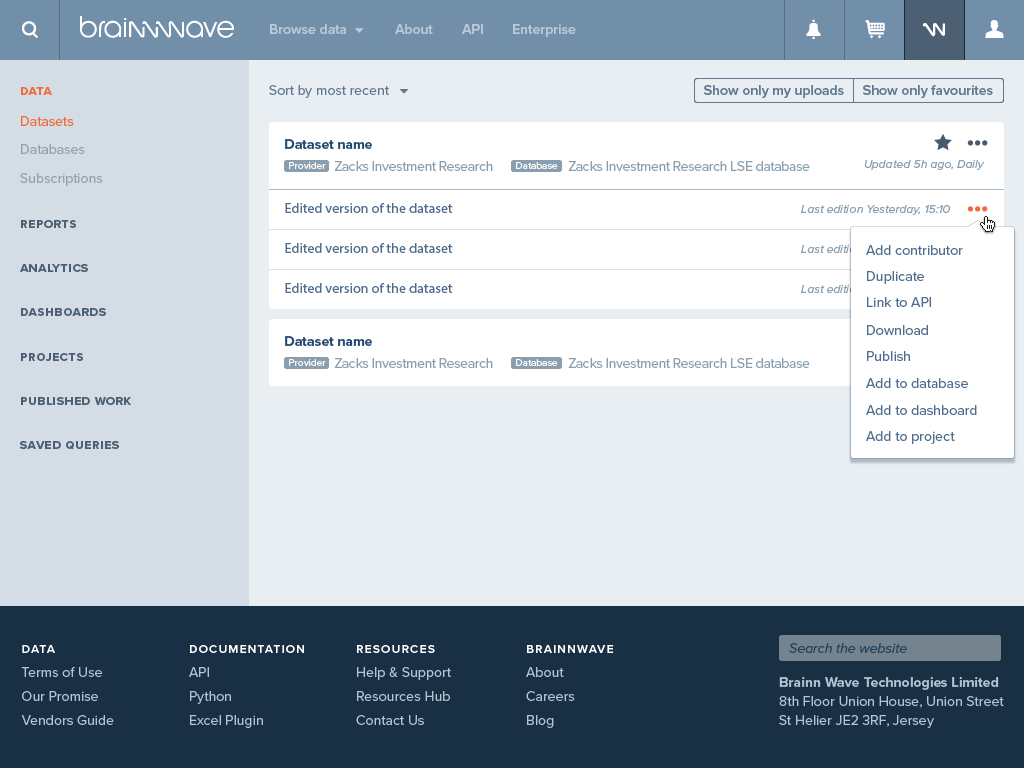
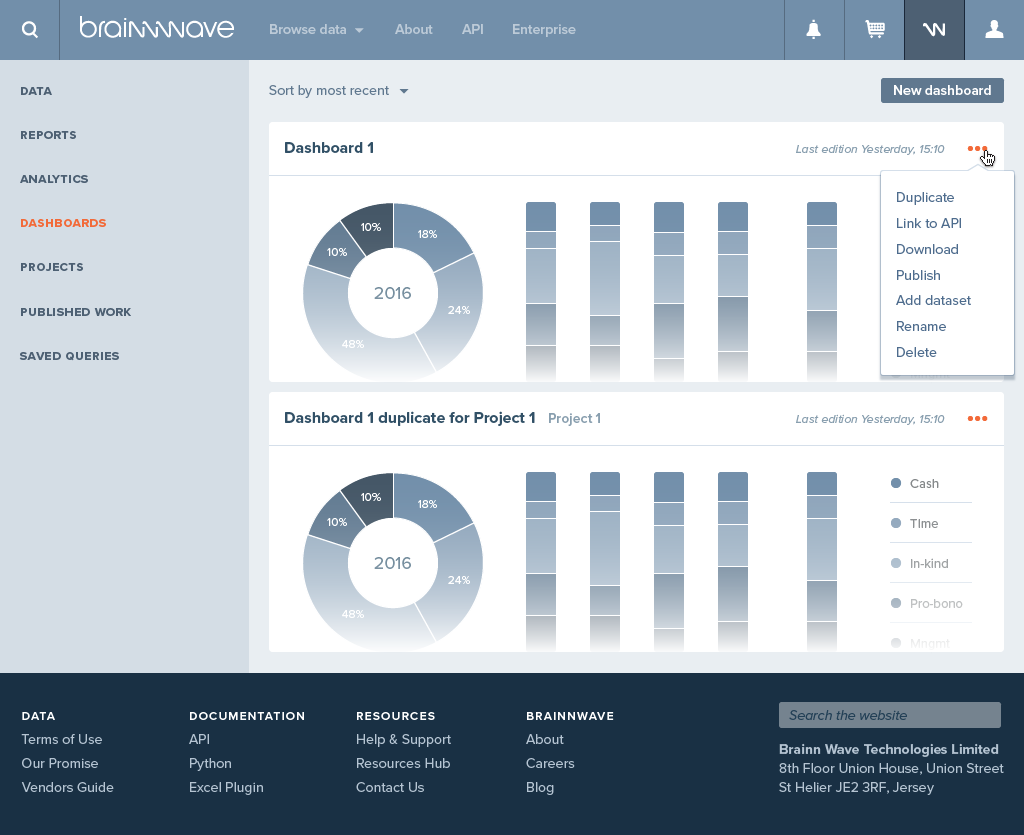
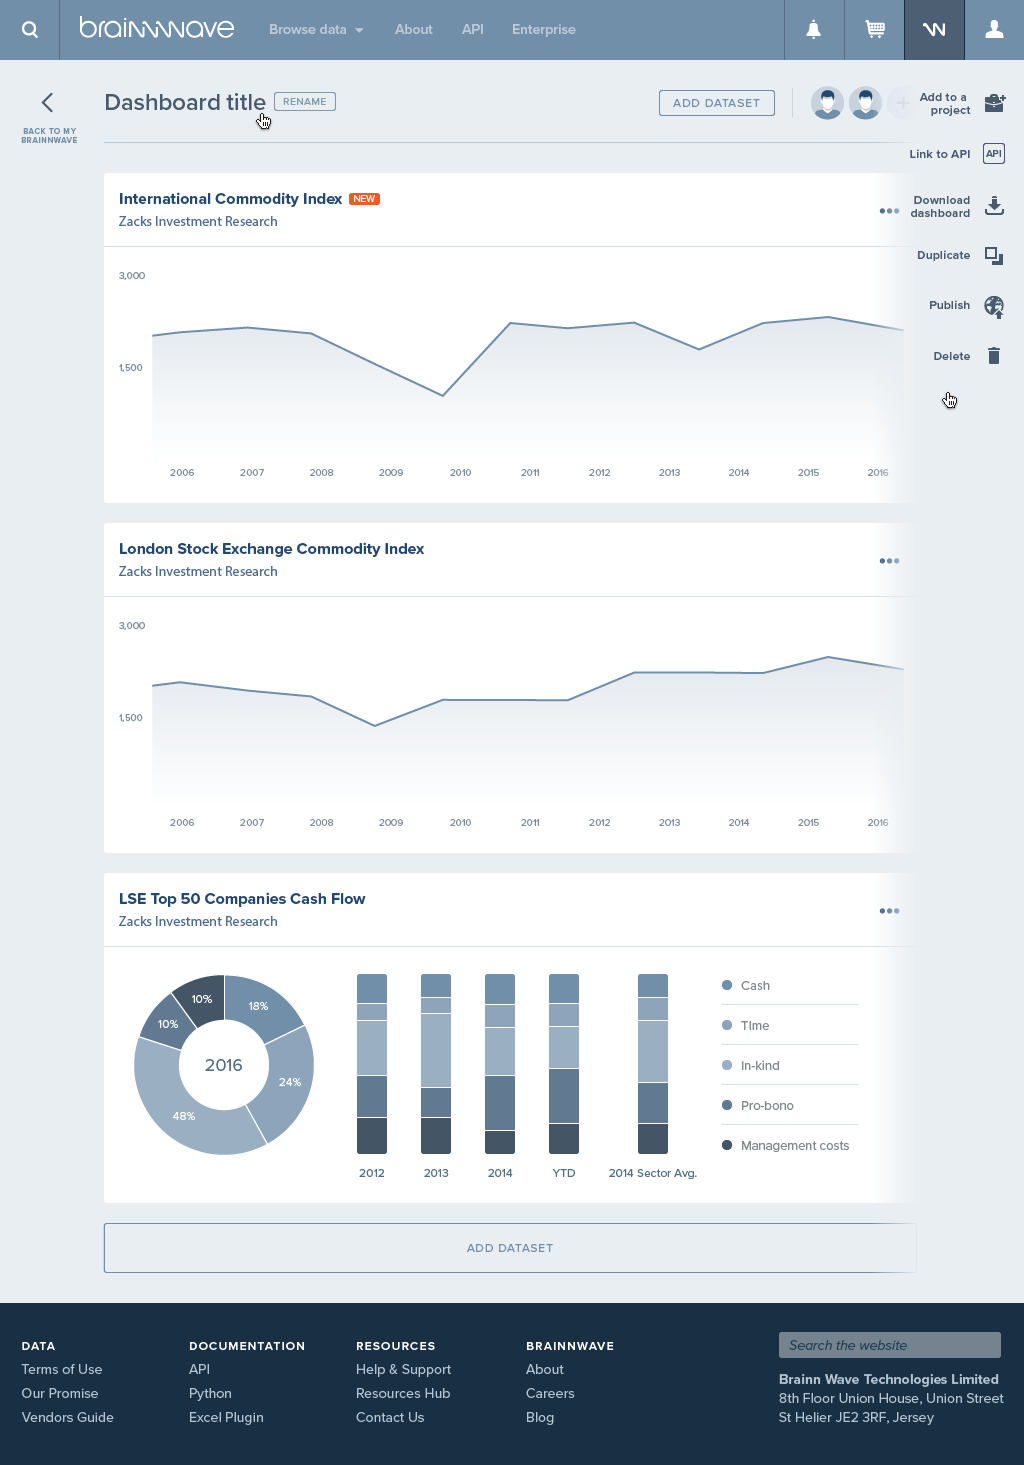
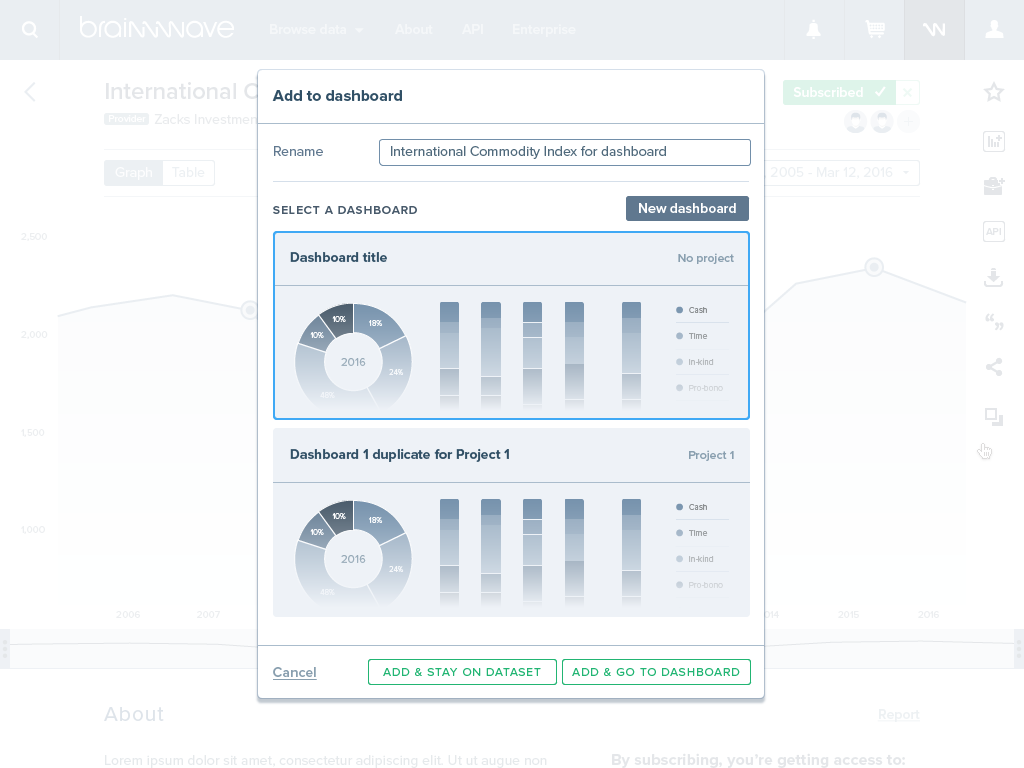
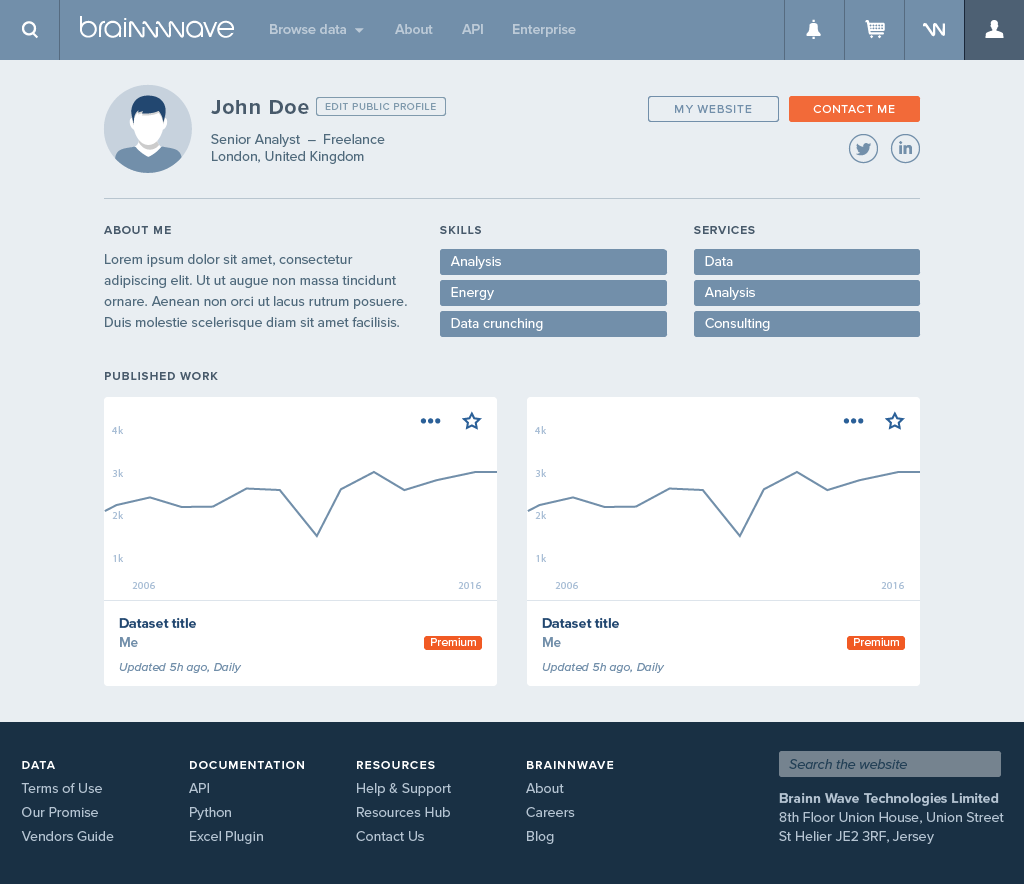
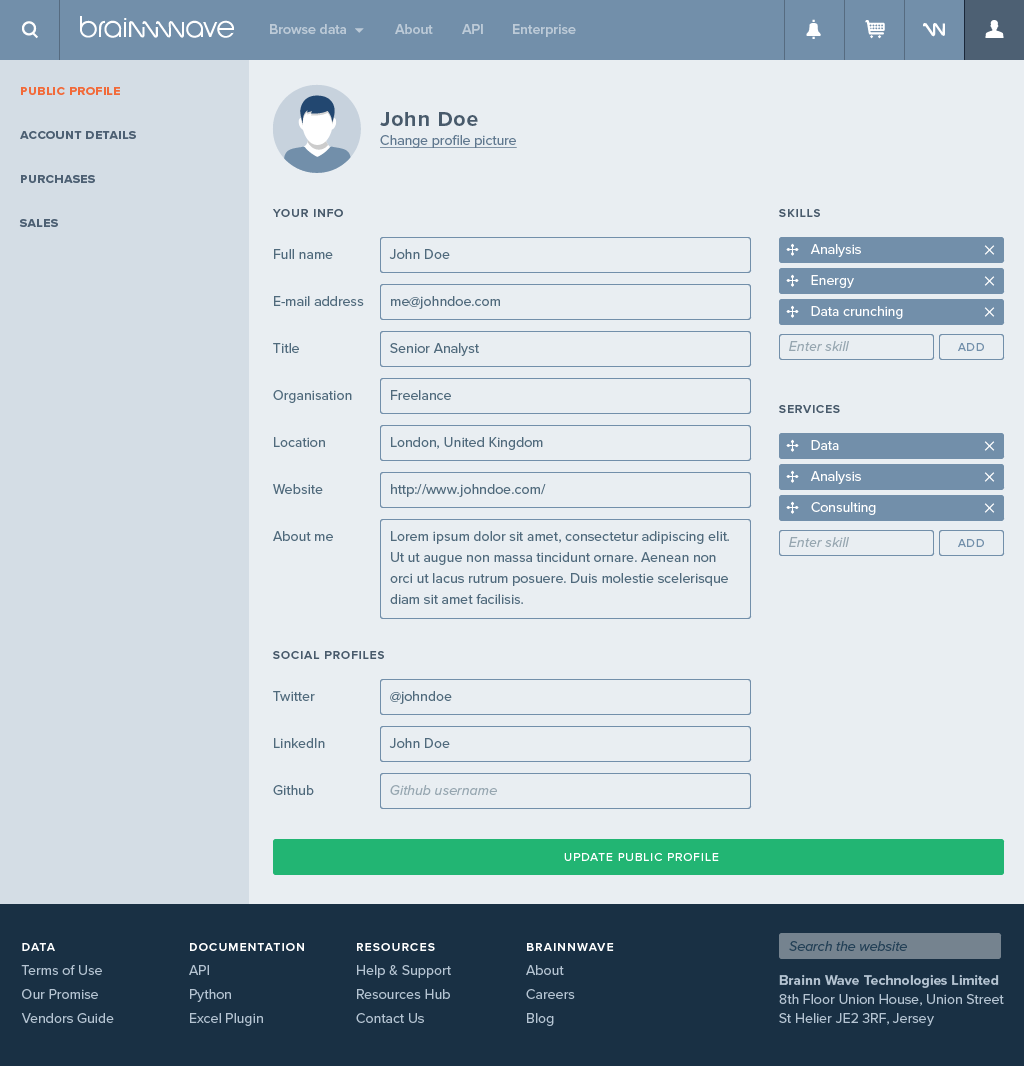
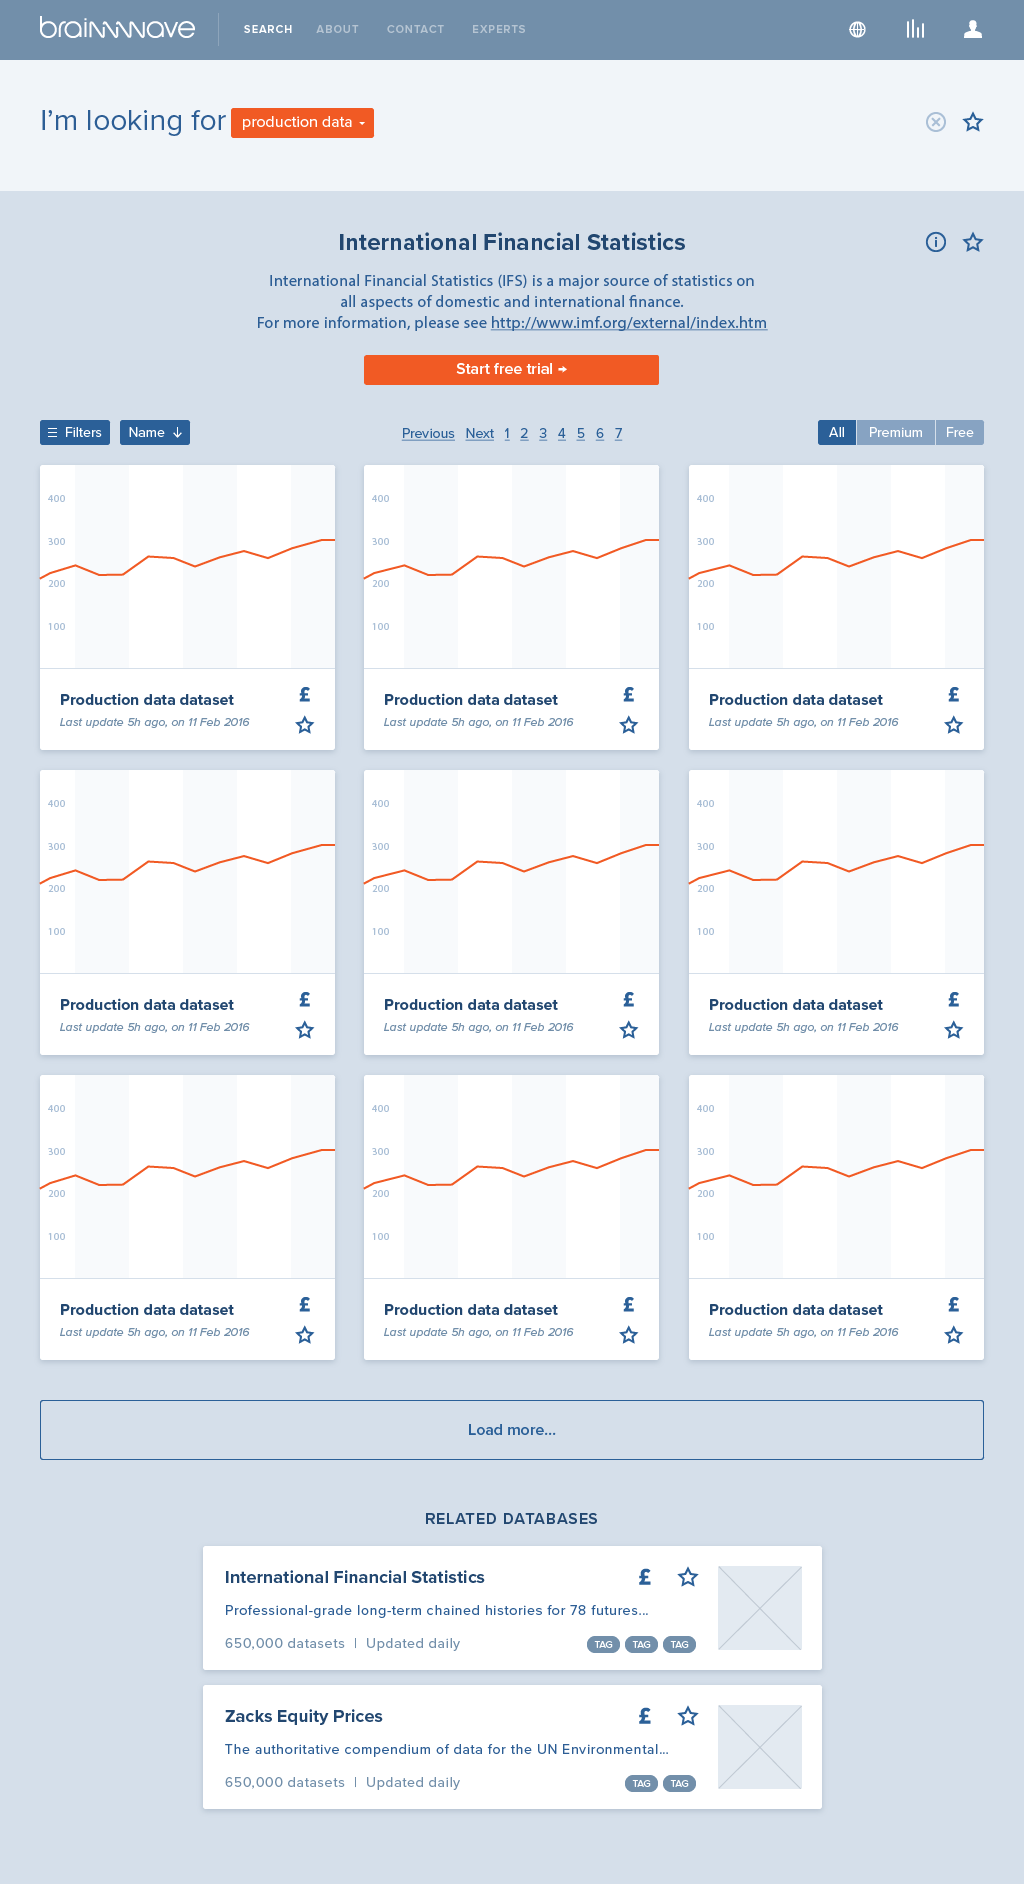
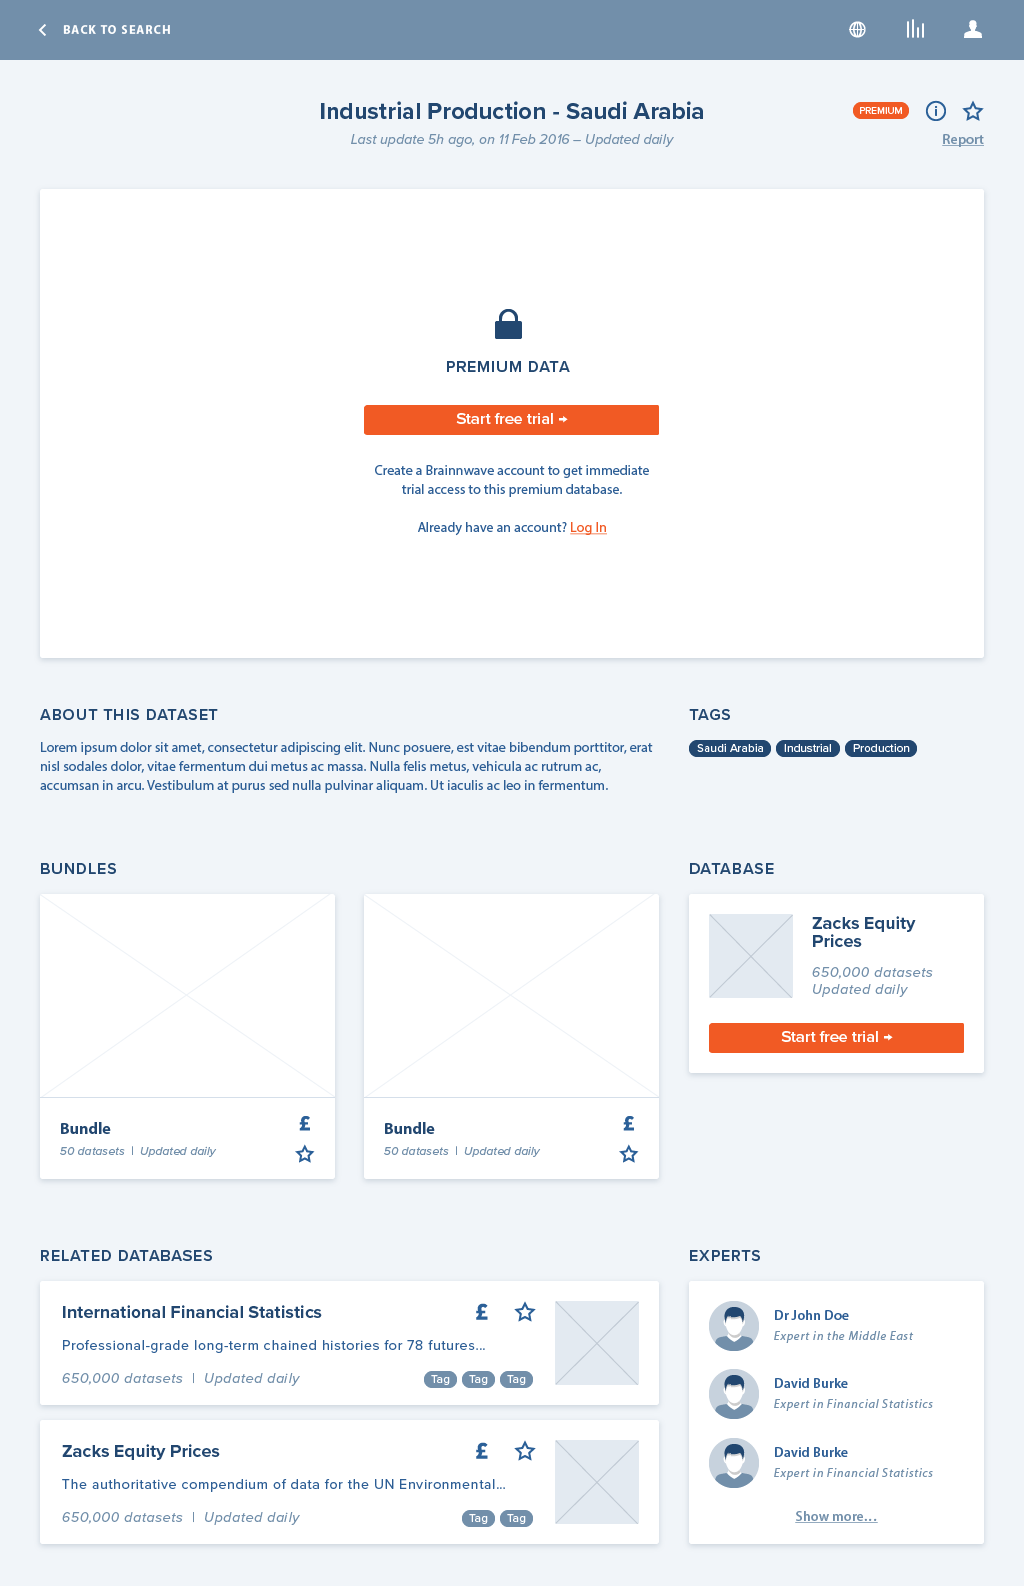
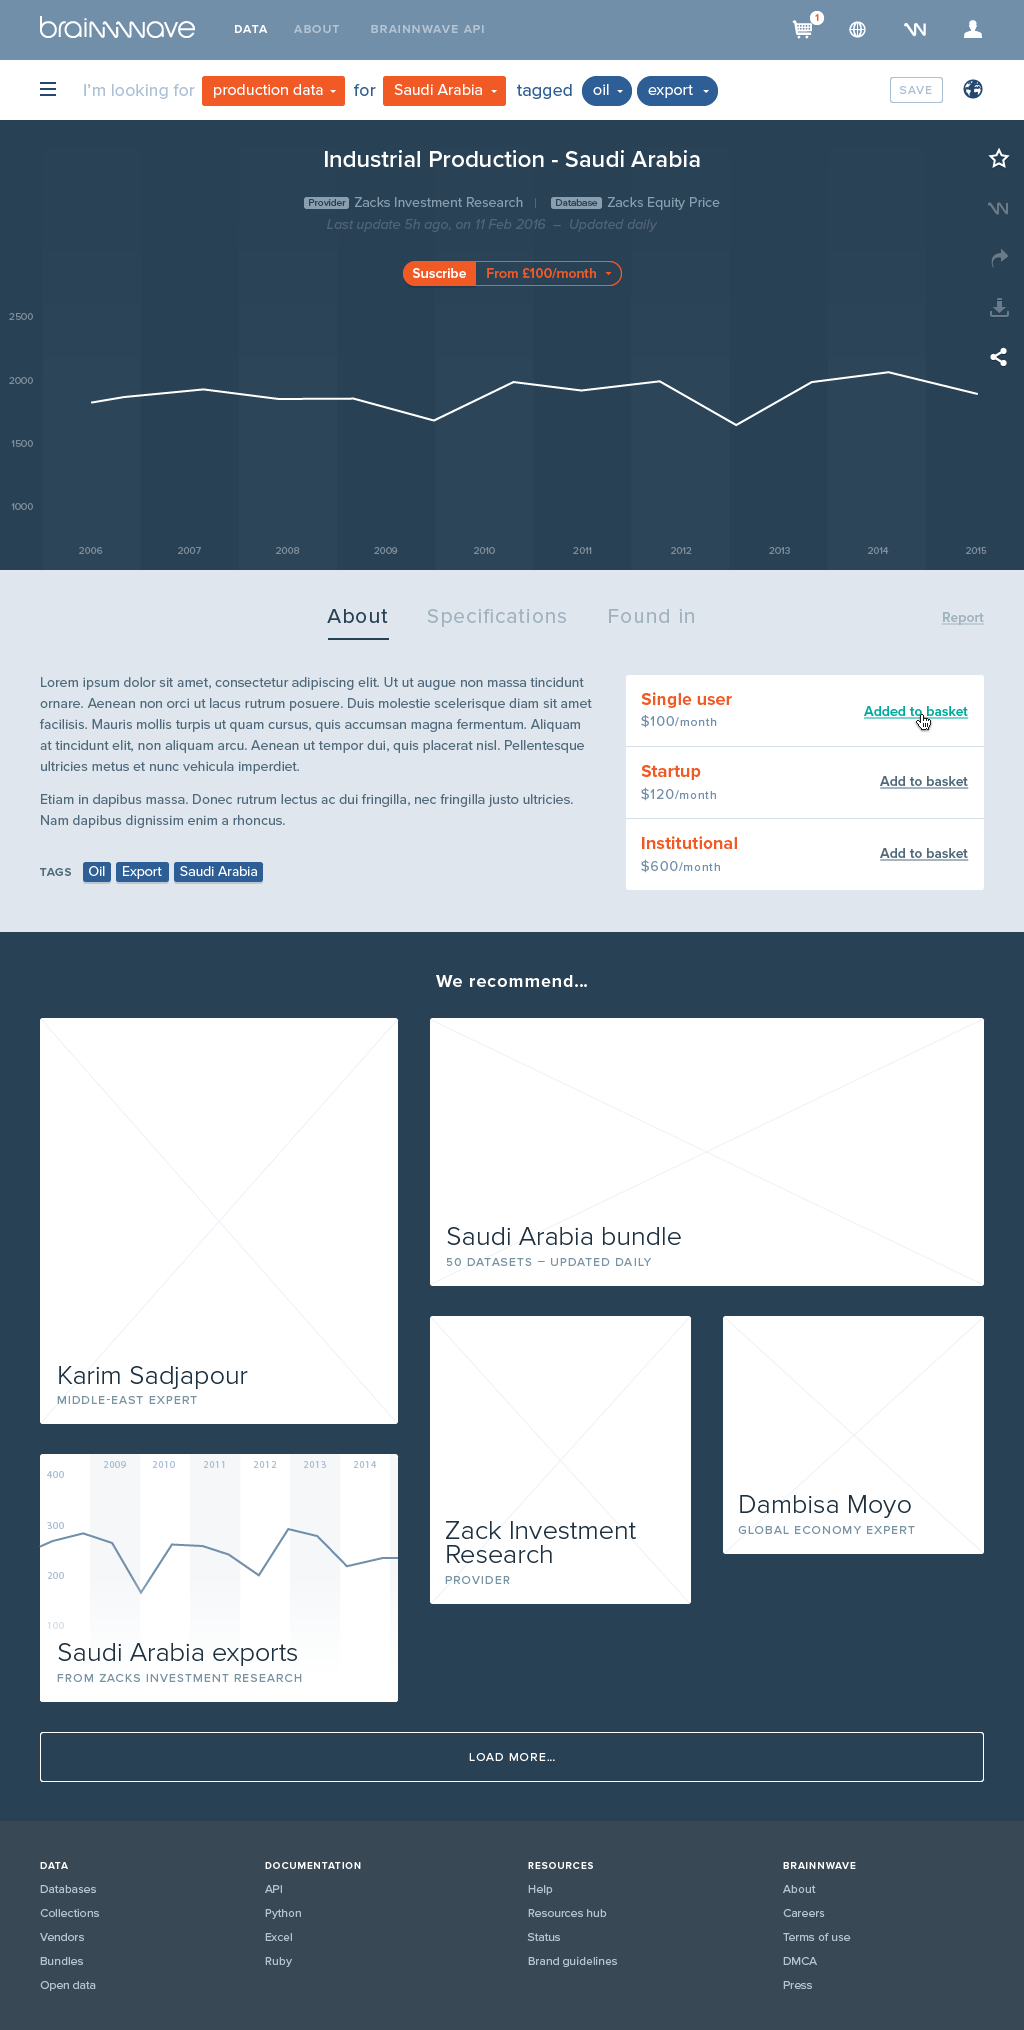
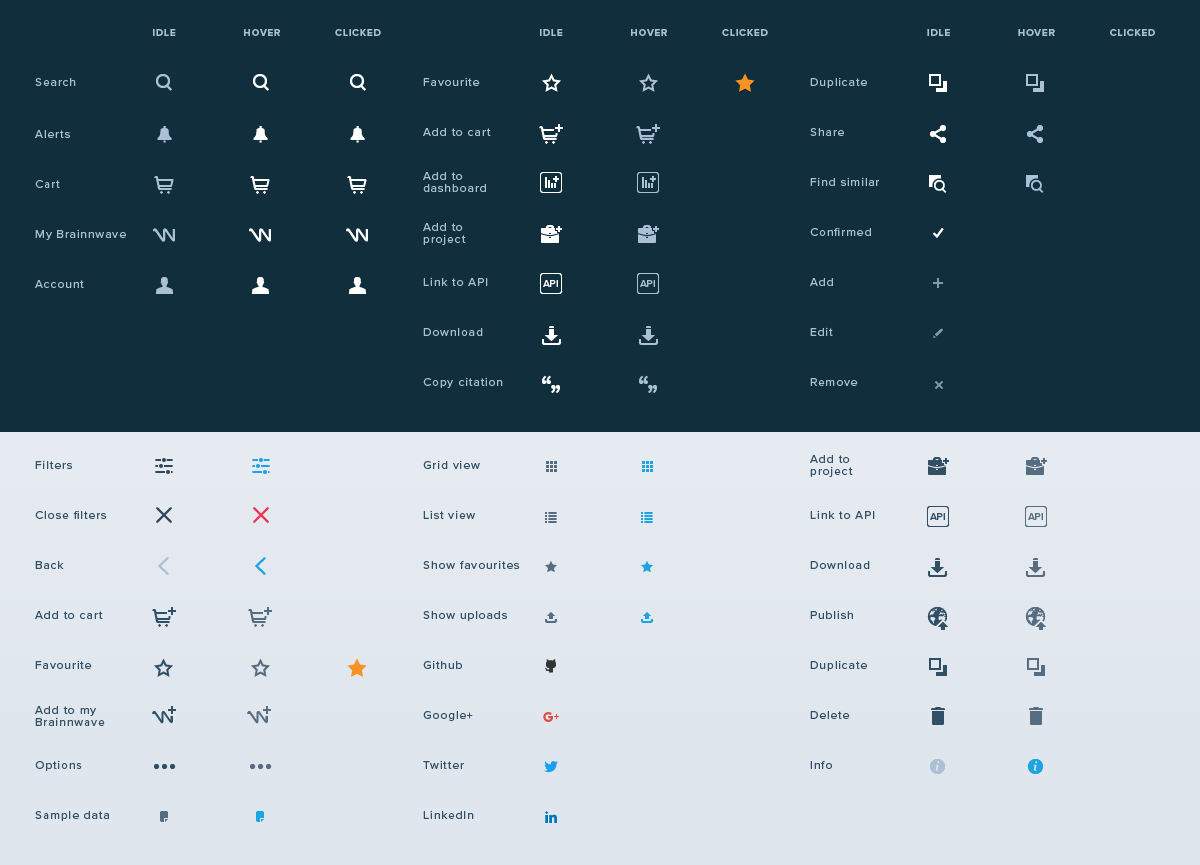
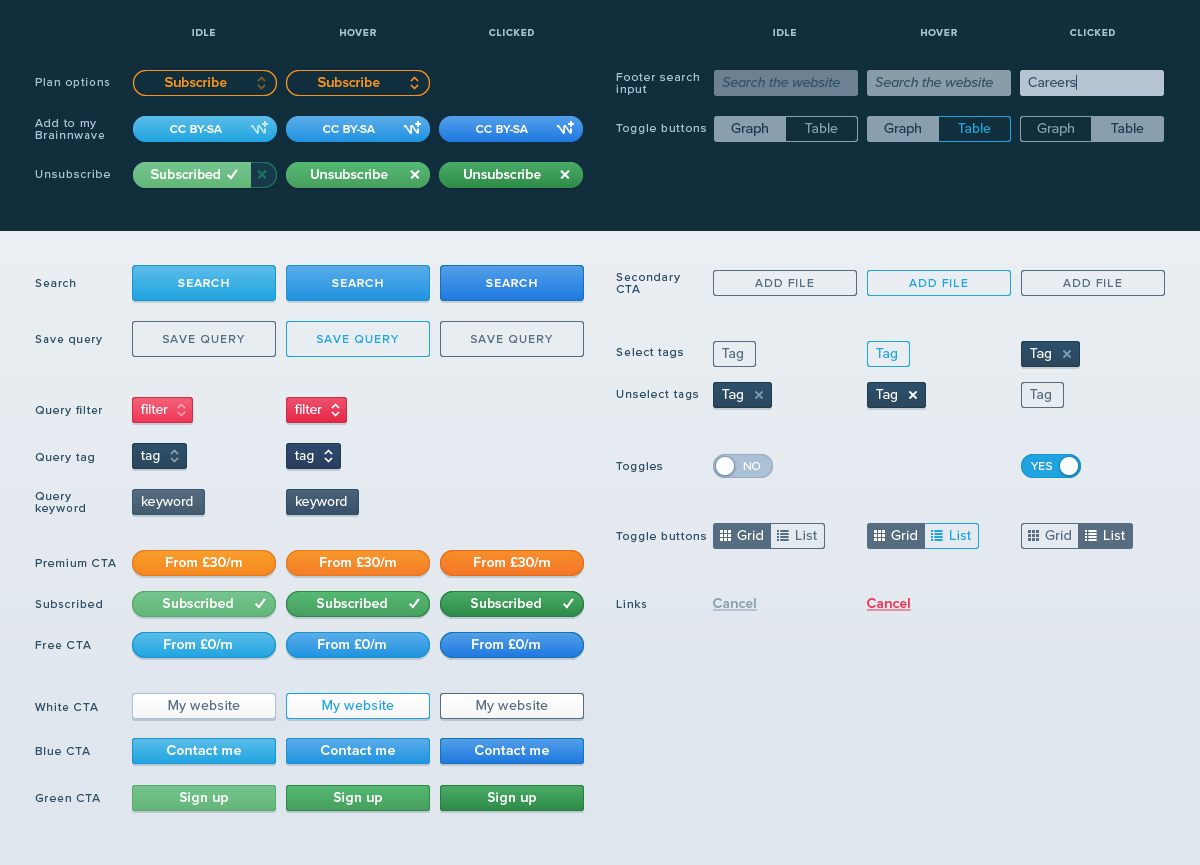
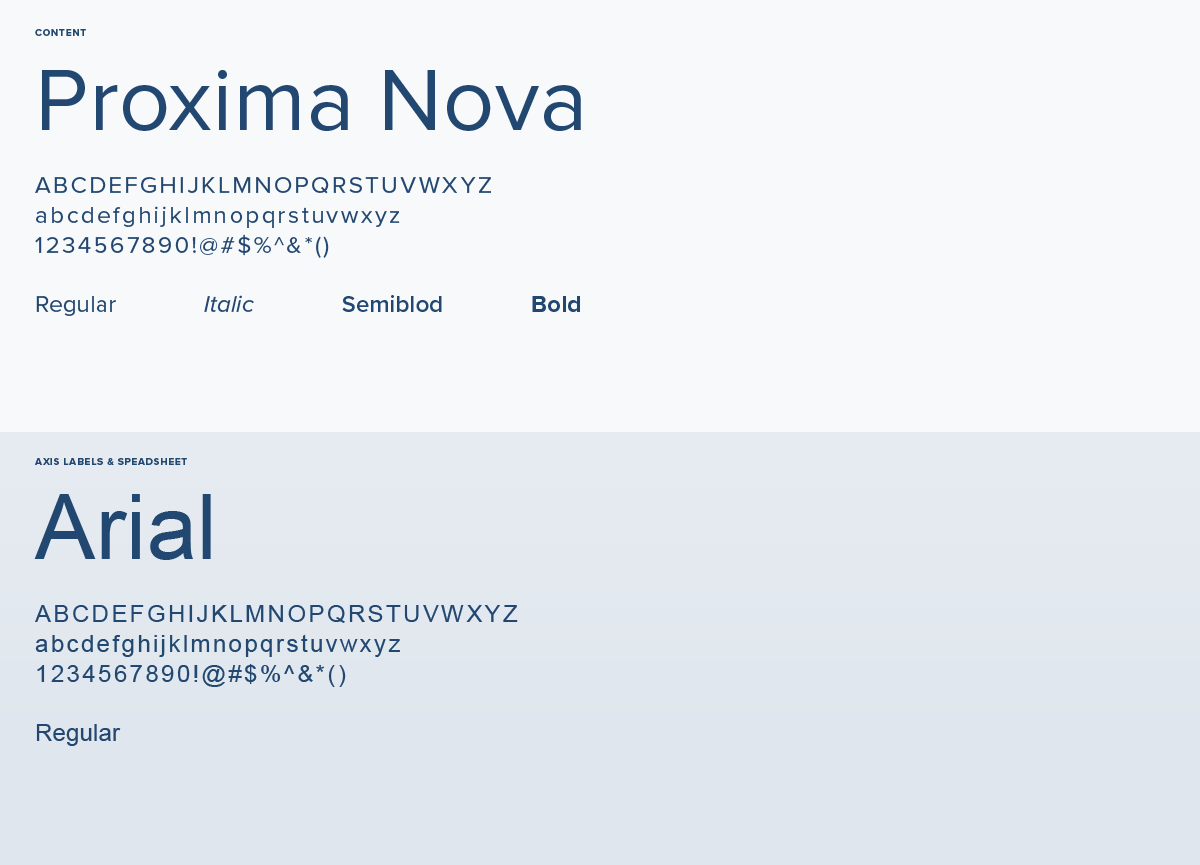
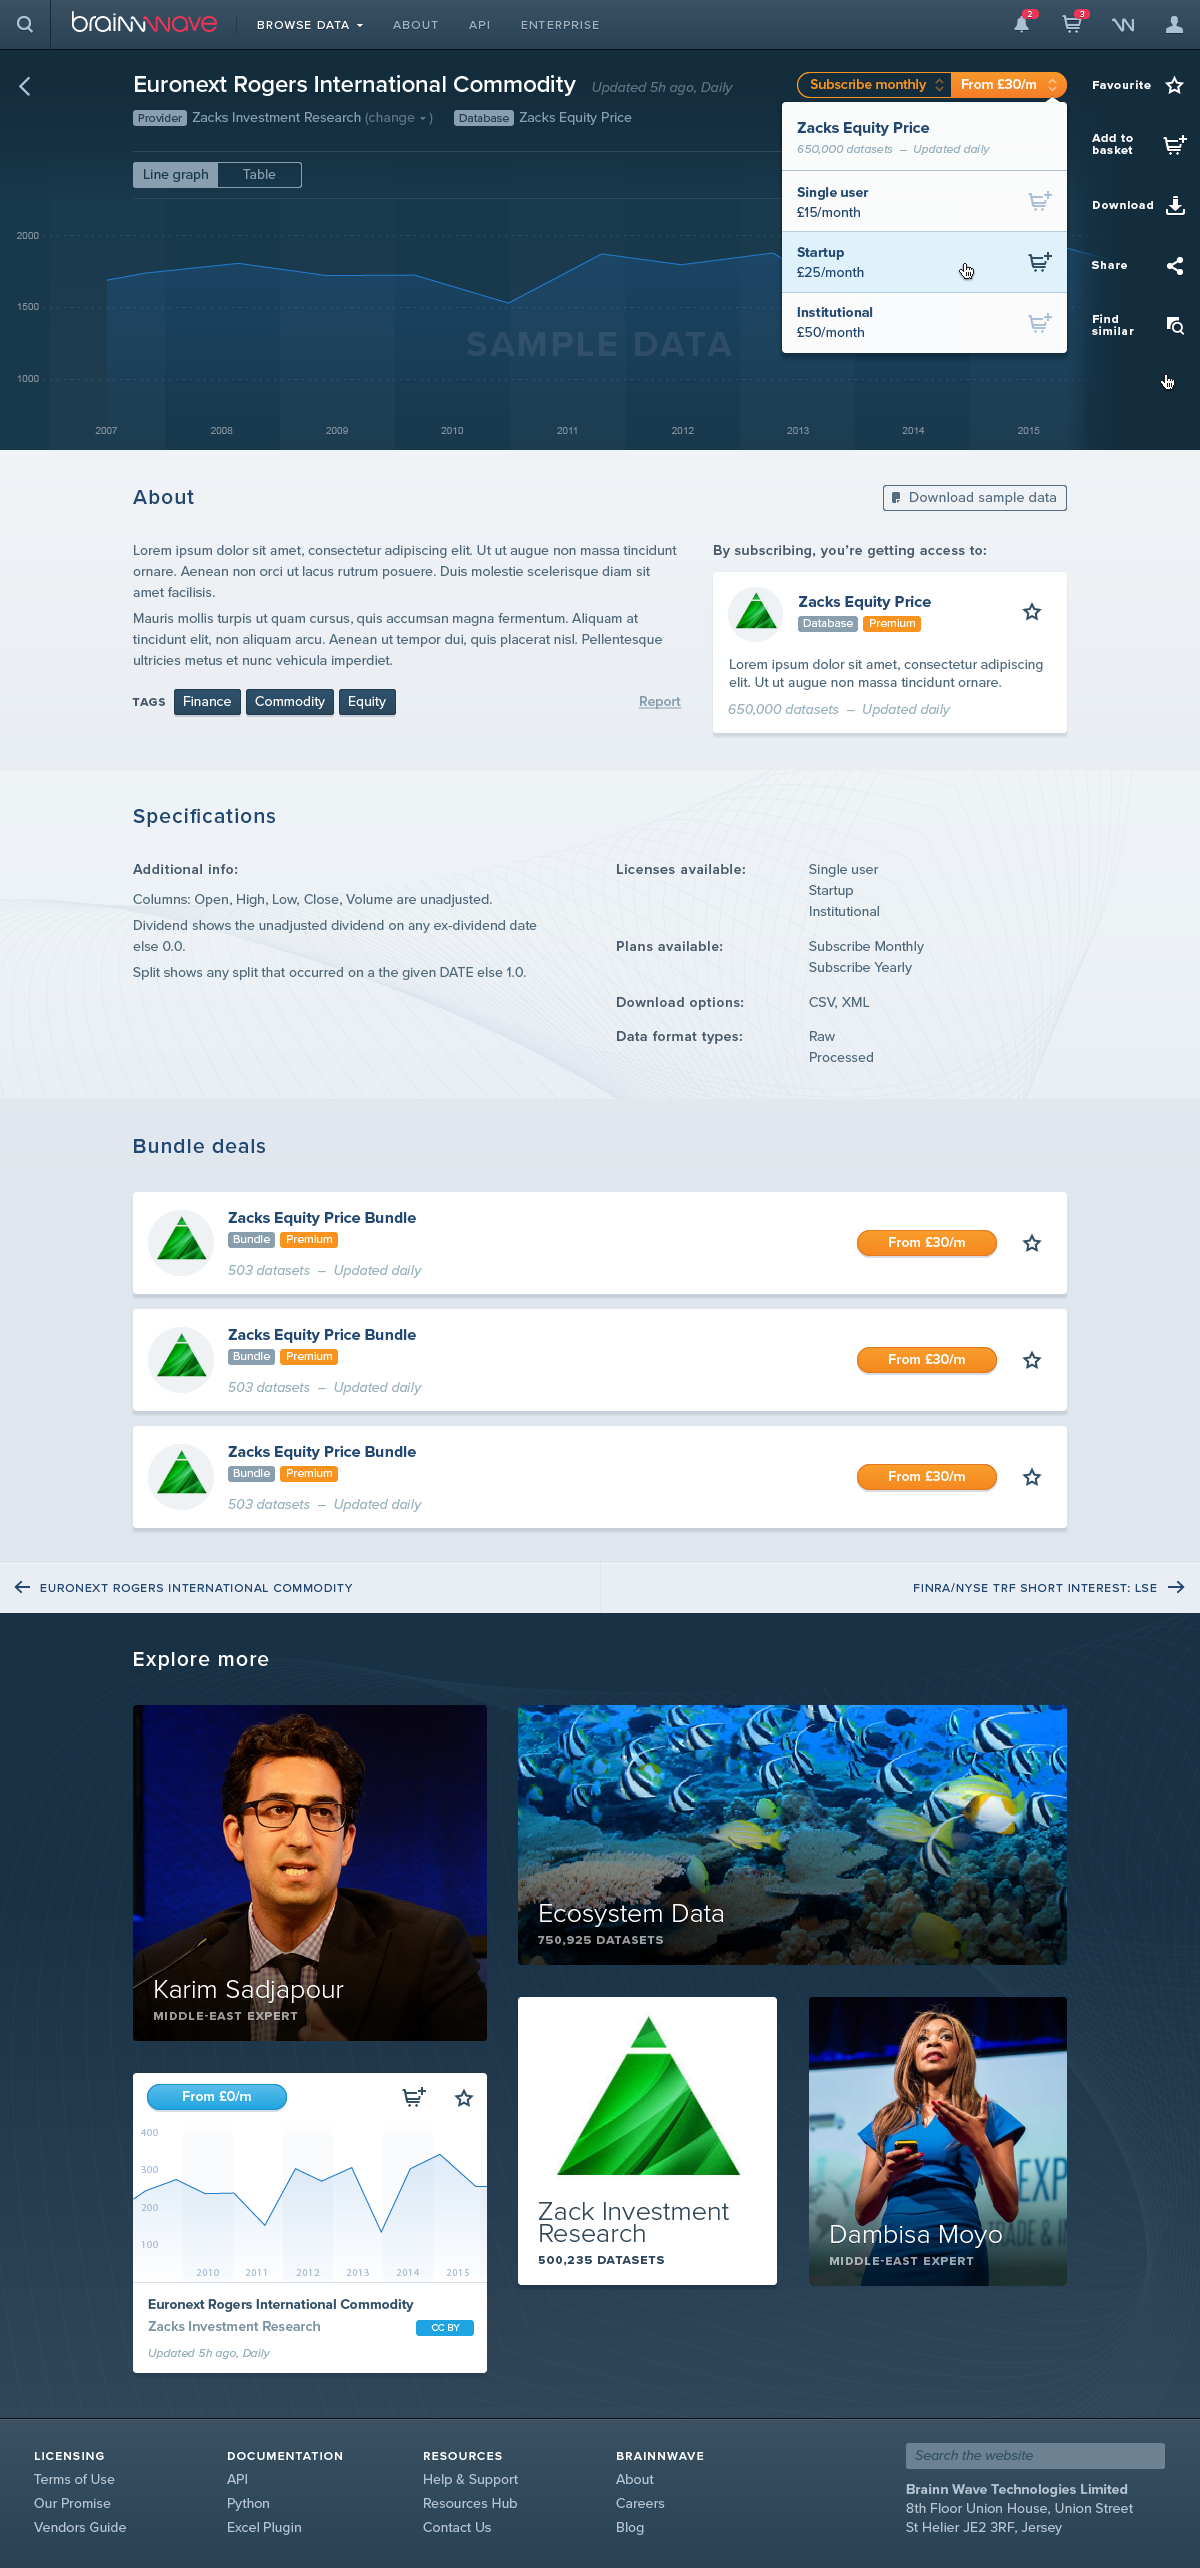
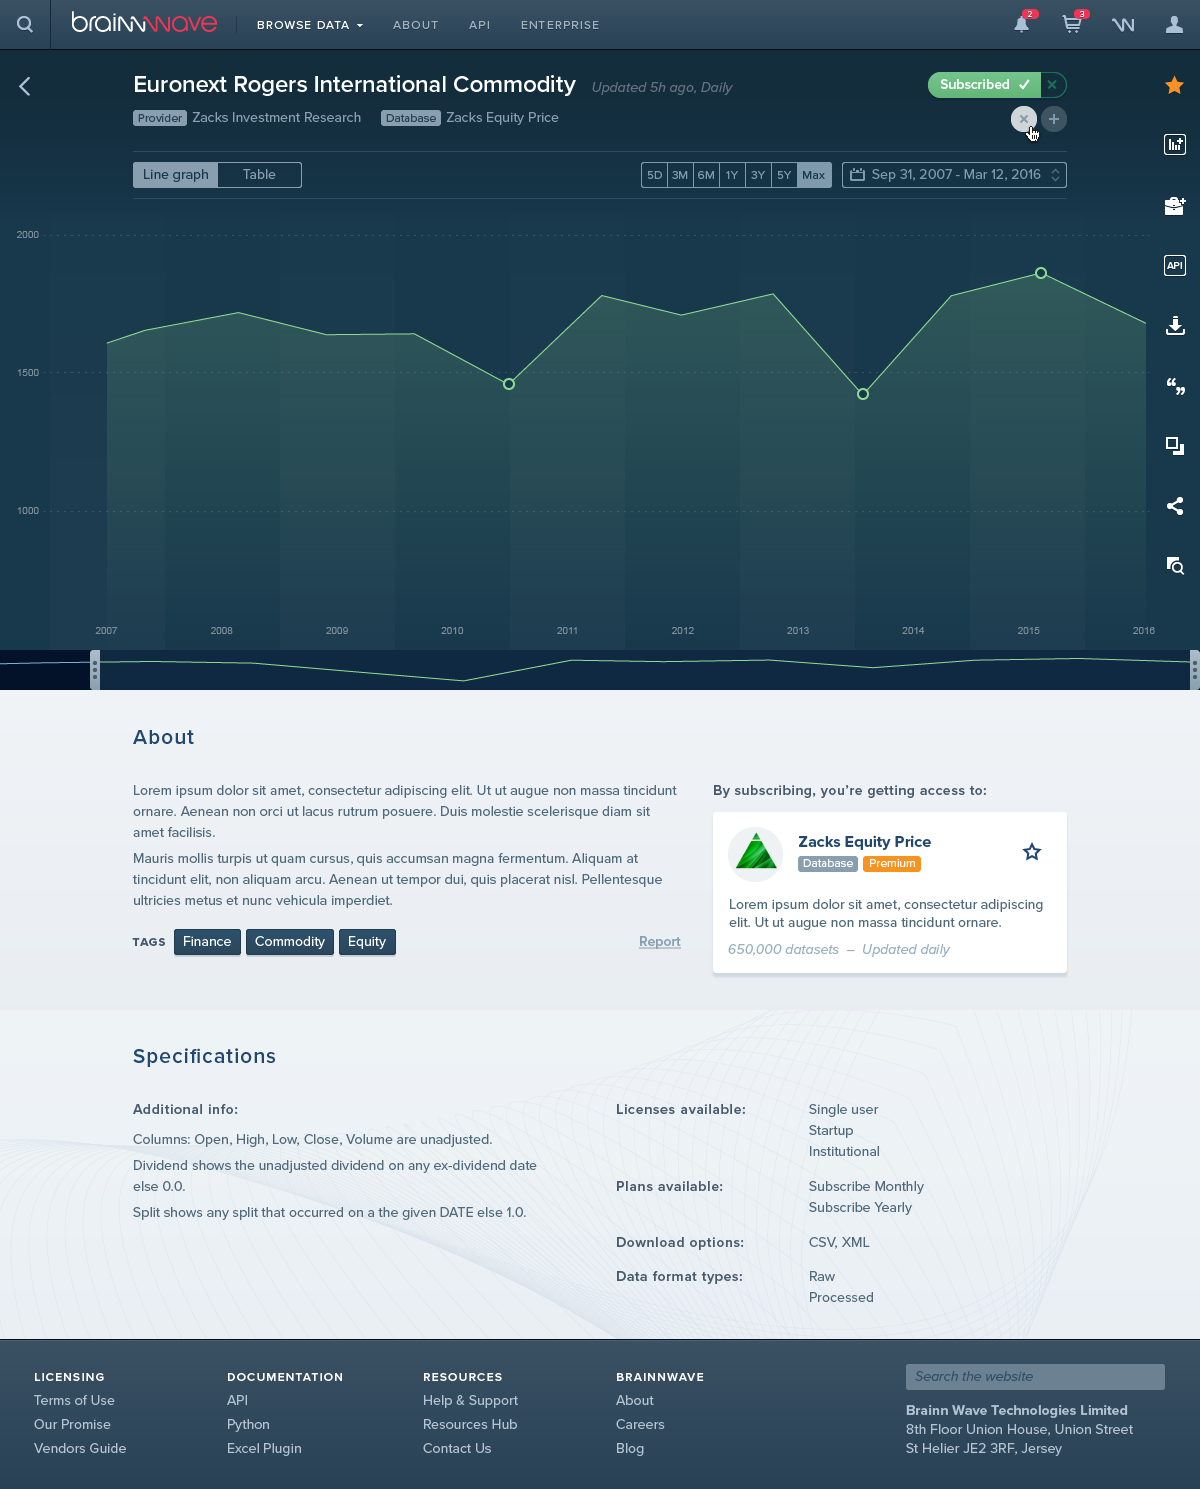
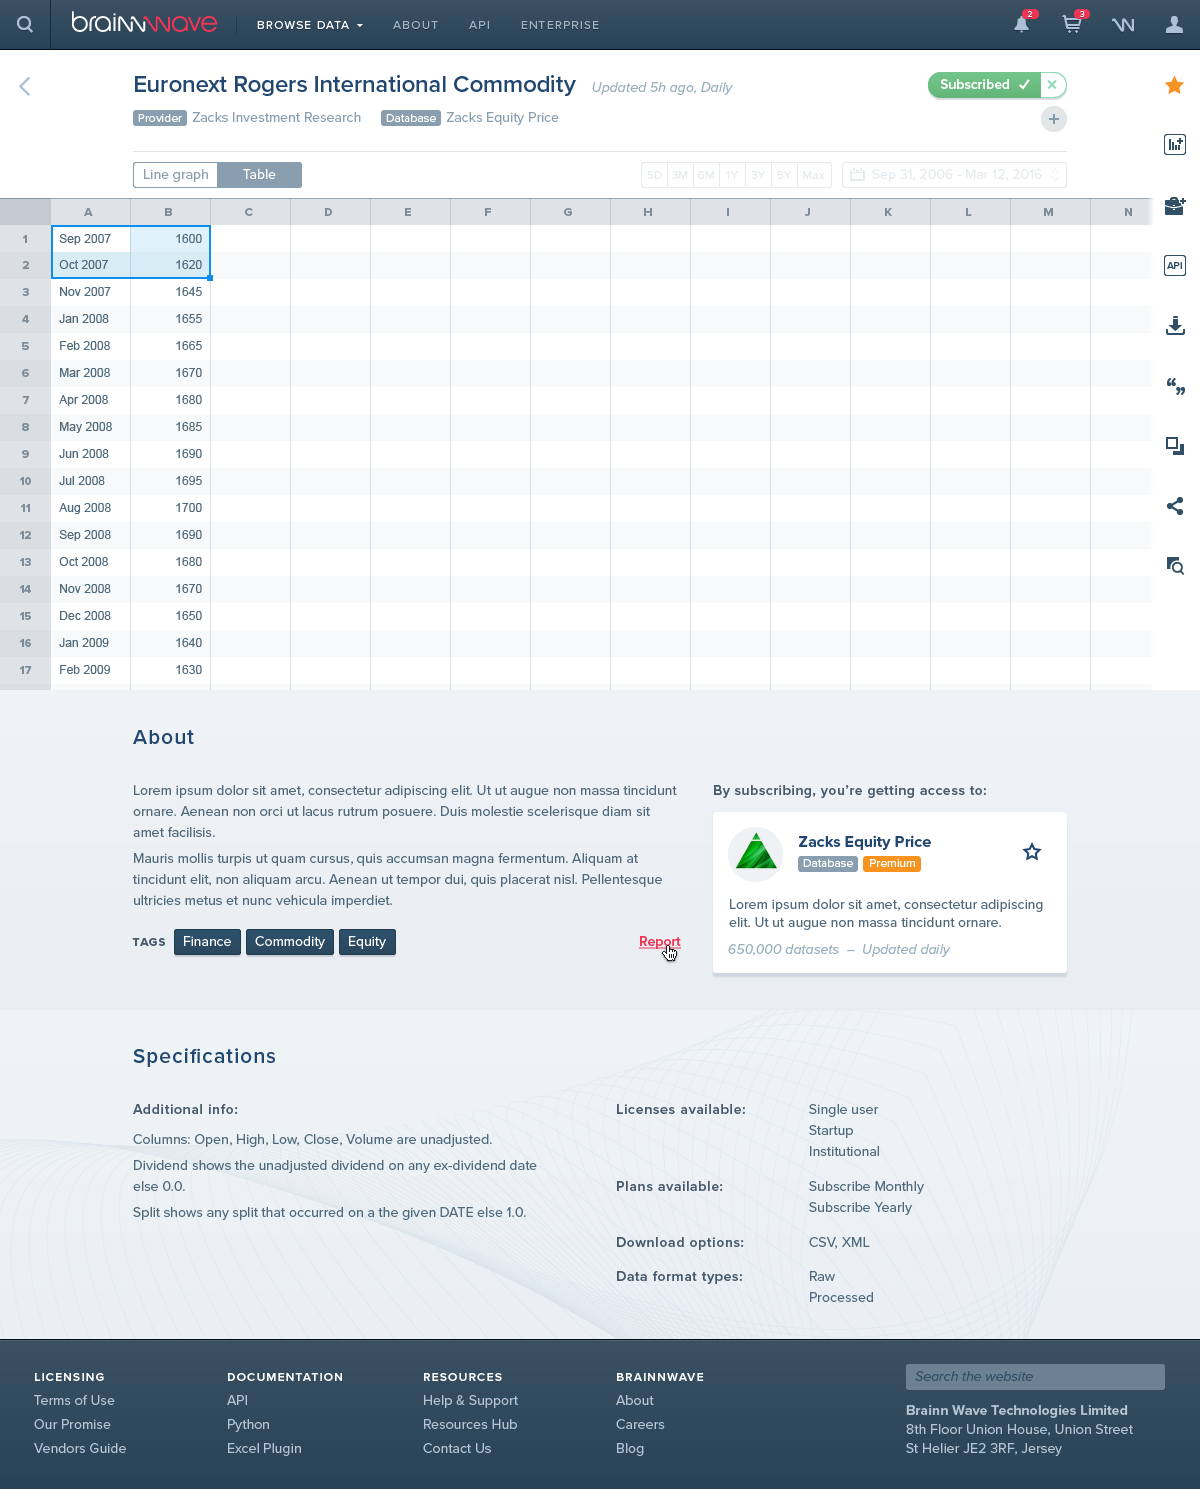
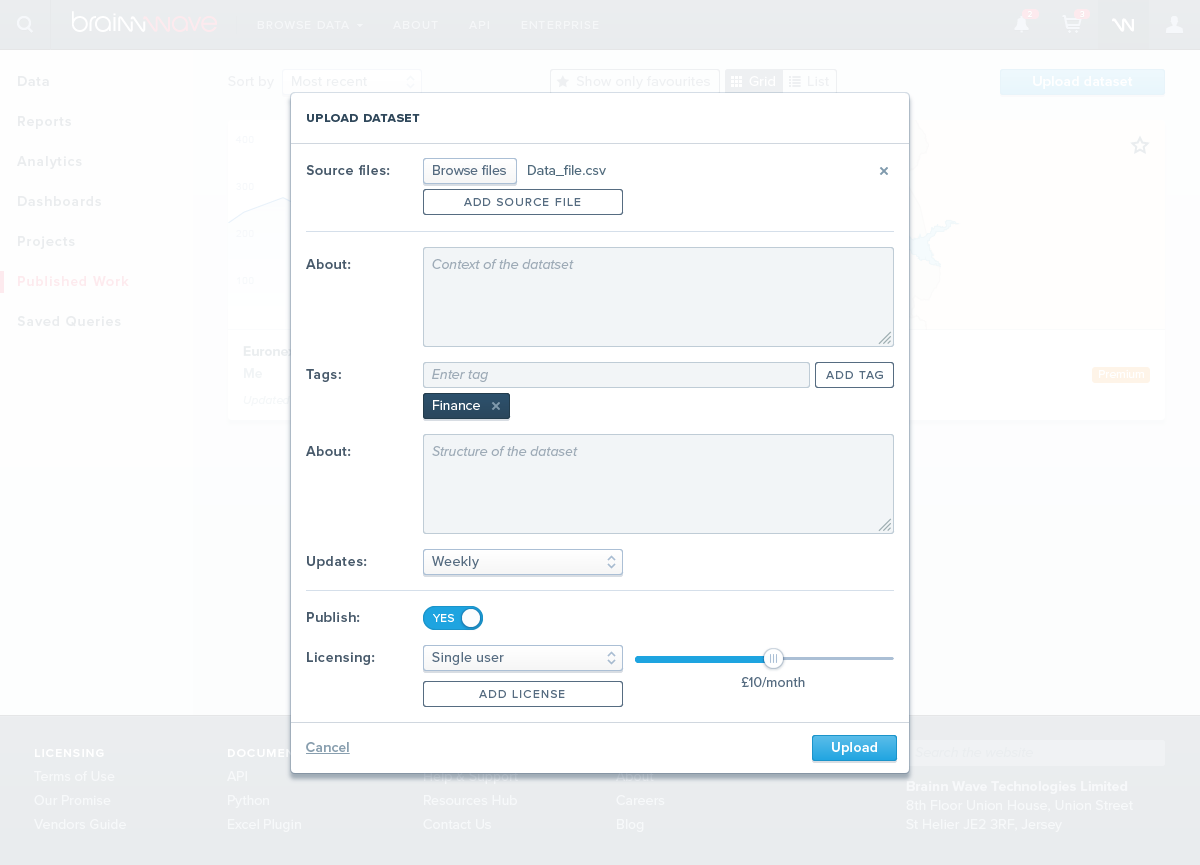
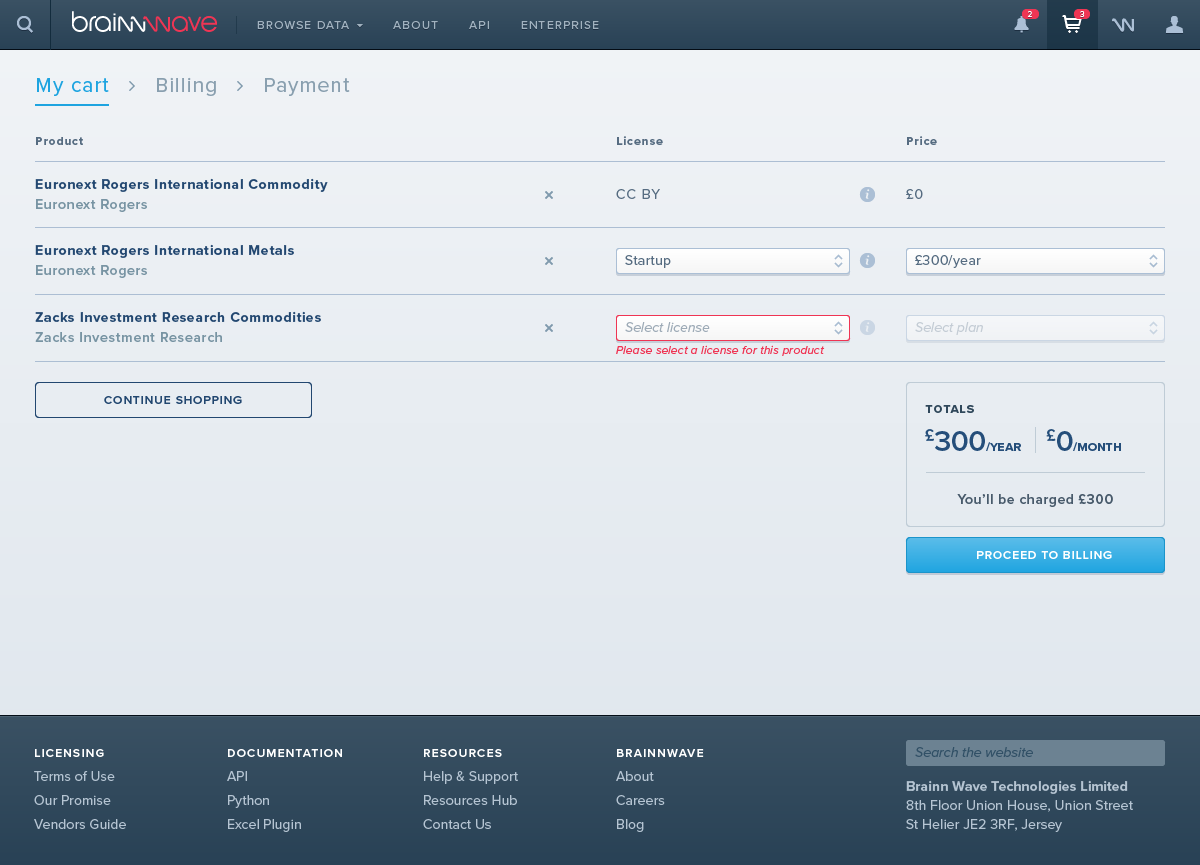
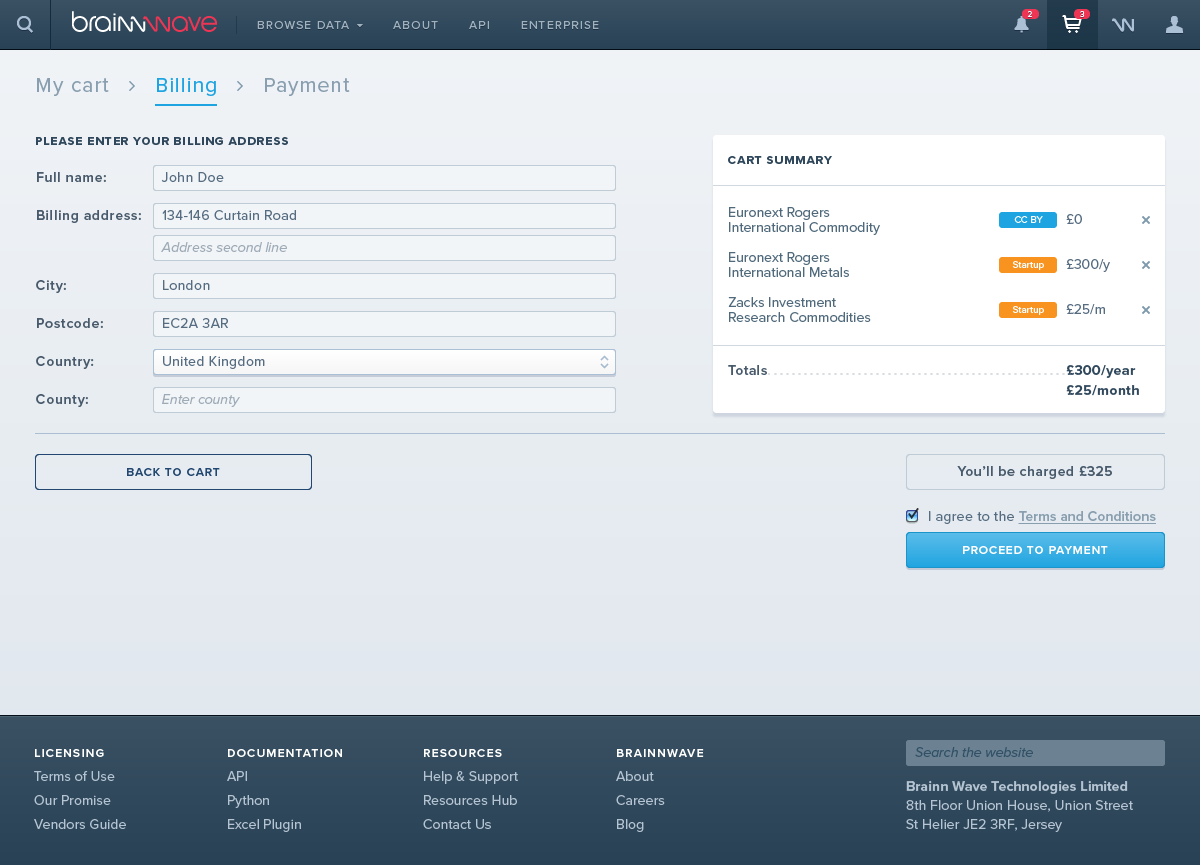
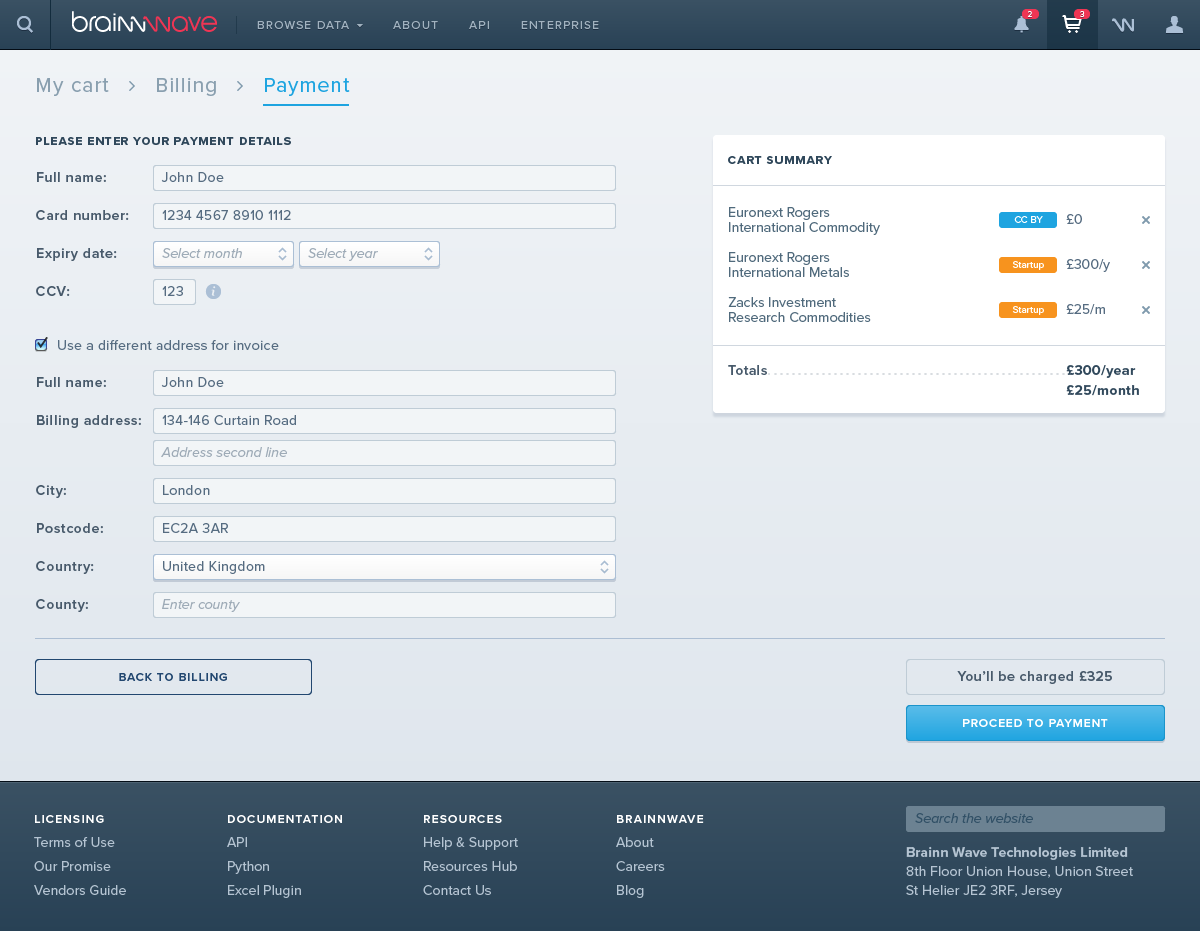
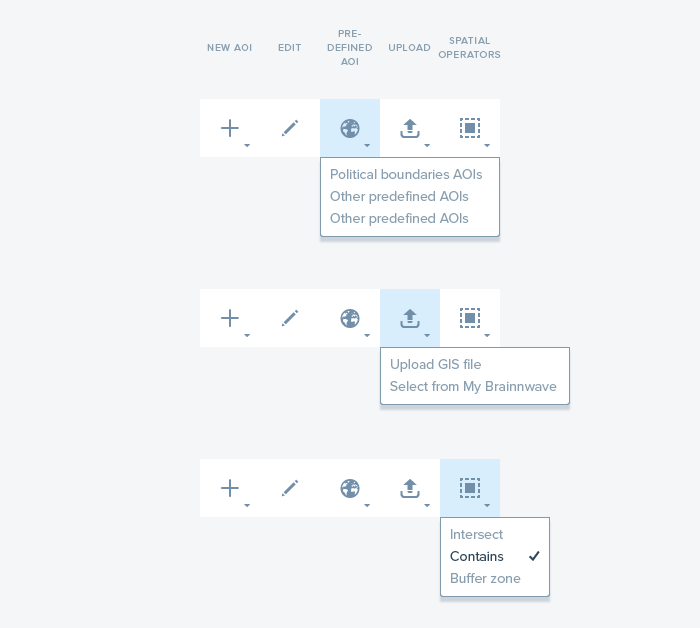
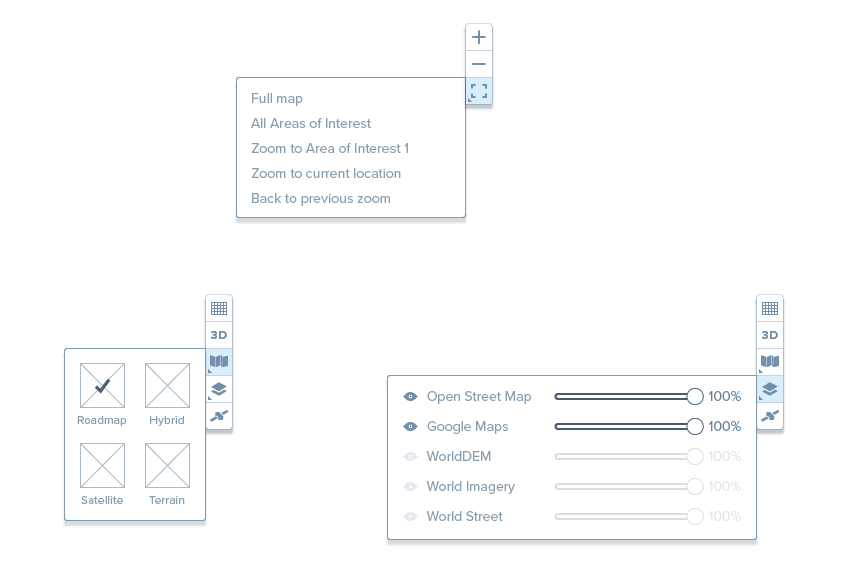
Once the UX and UI firmly in place we started building a visual language for the marketplace, carefully creating icons, states and call-to-action hierarchy that could be used across the many, many screens of the application.
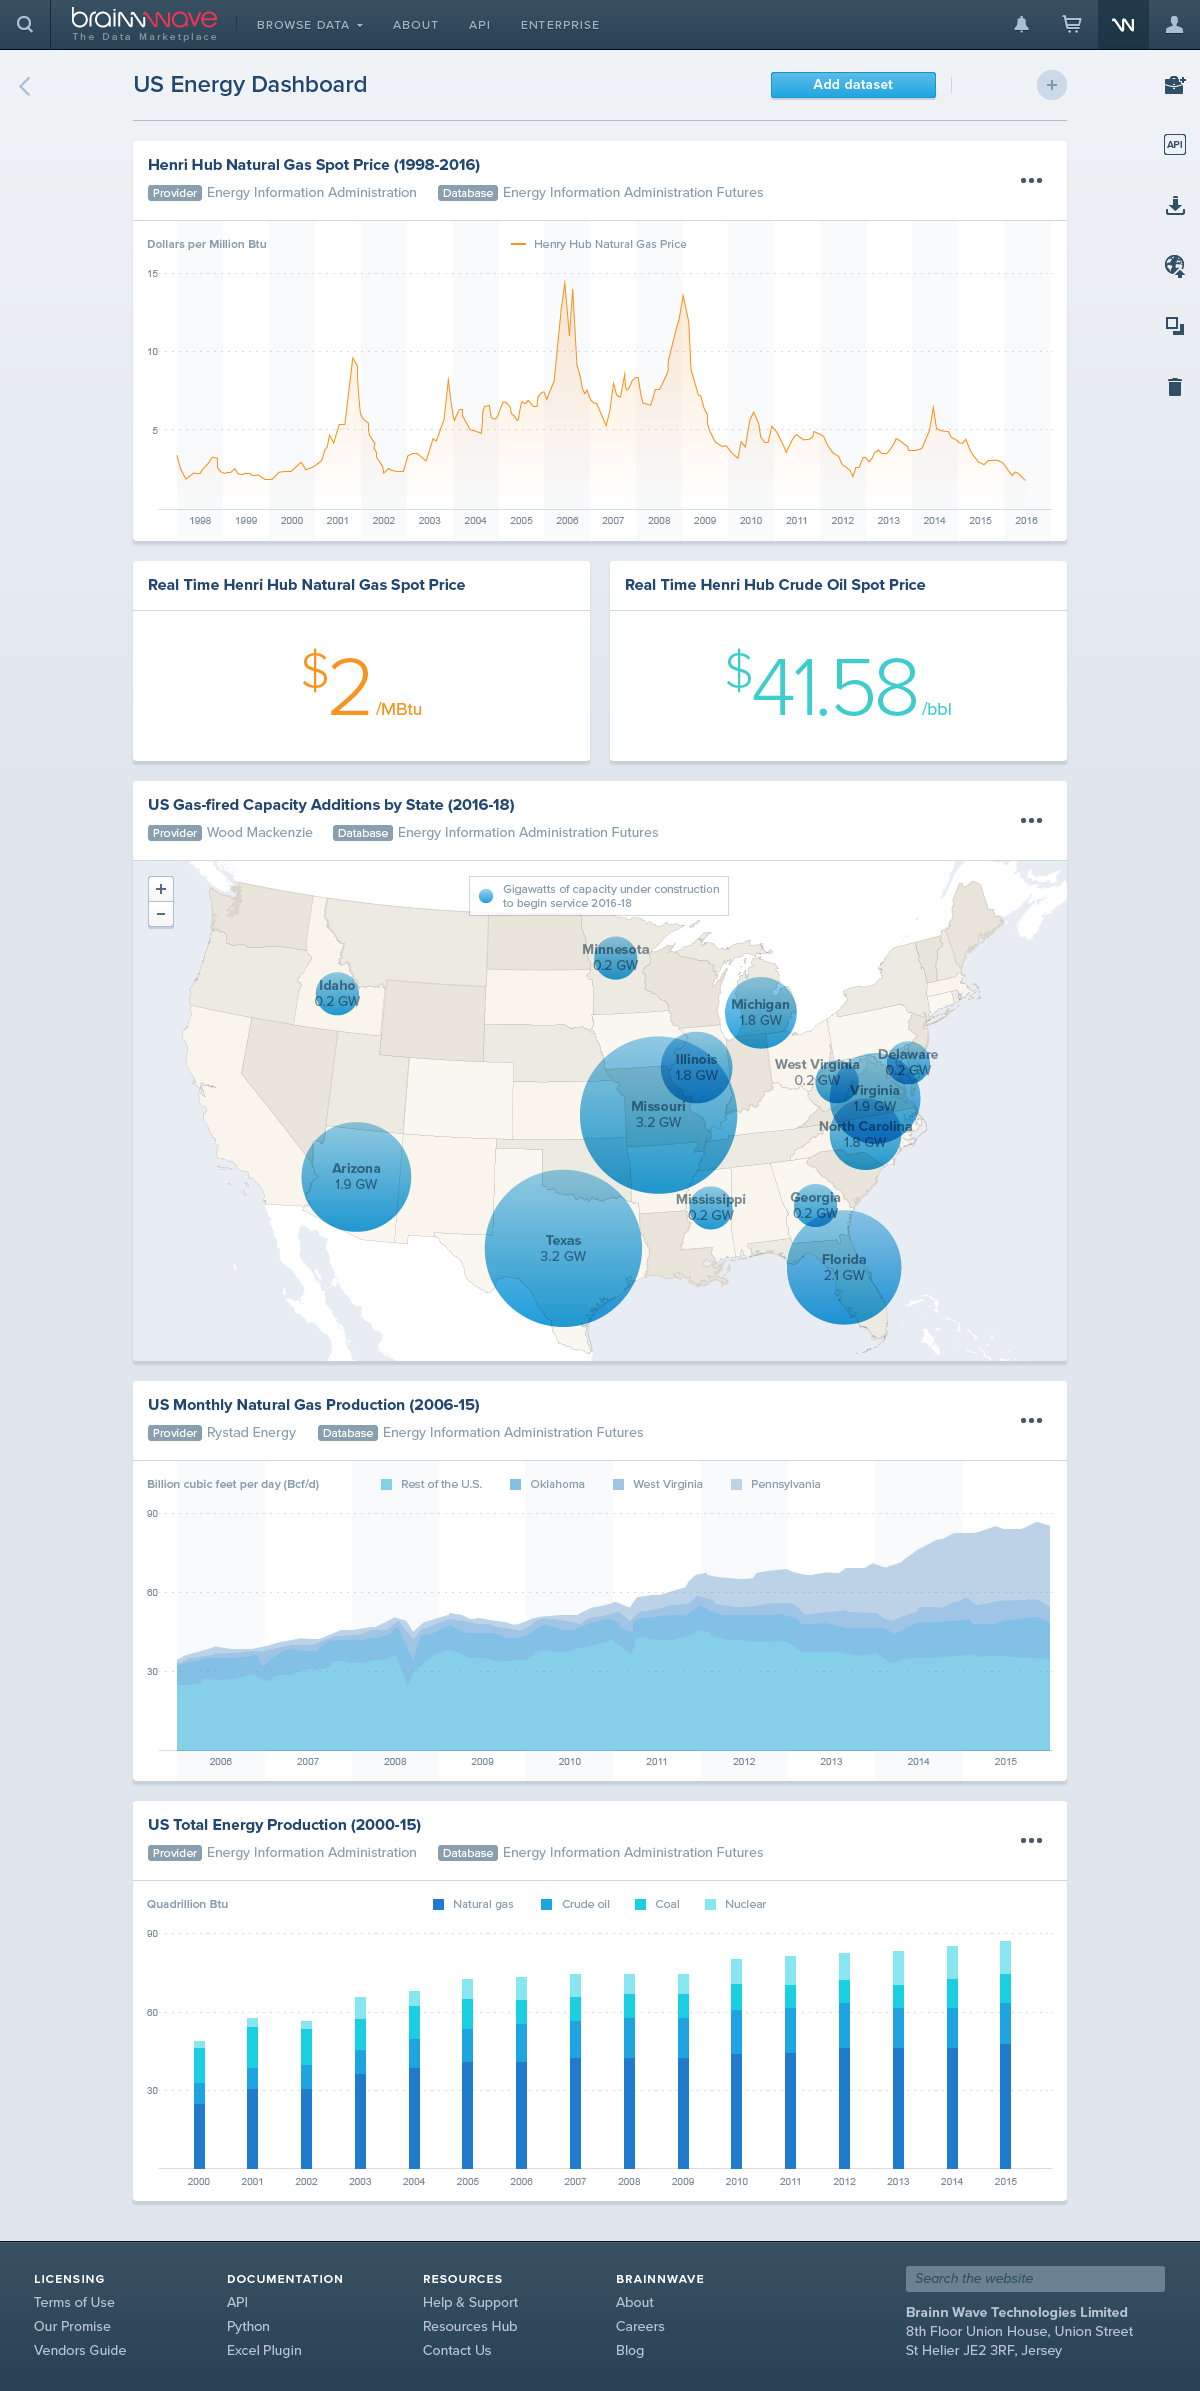
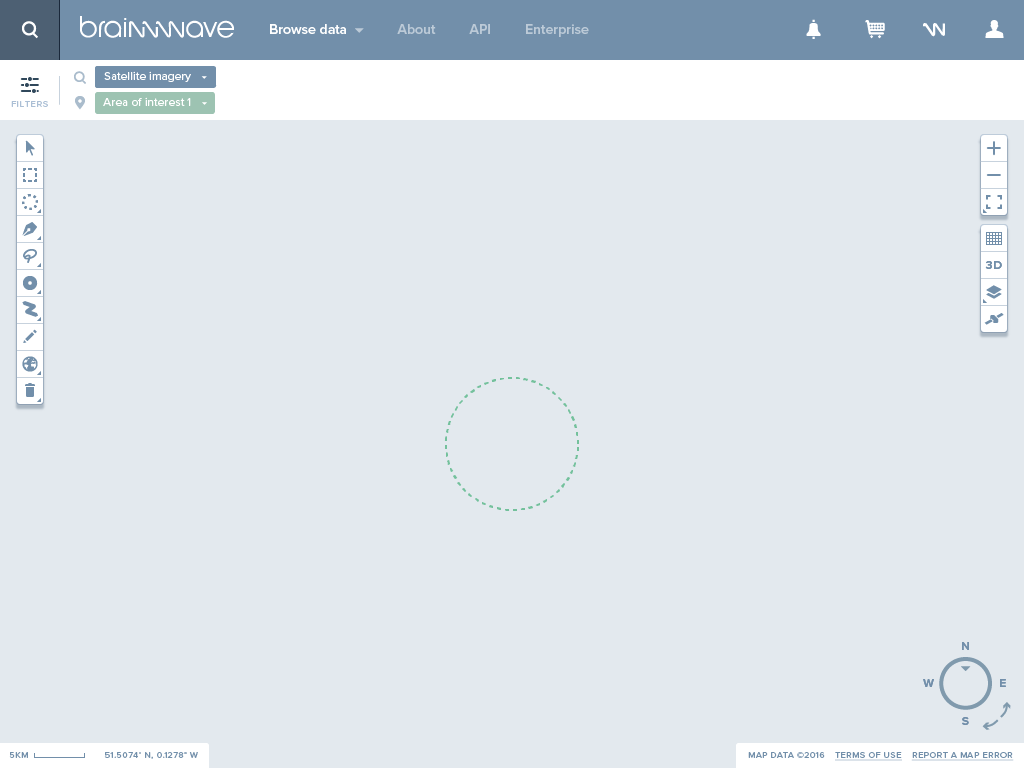
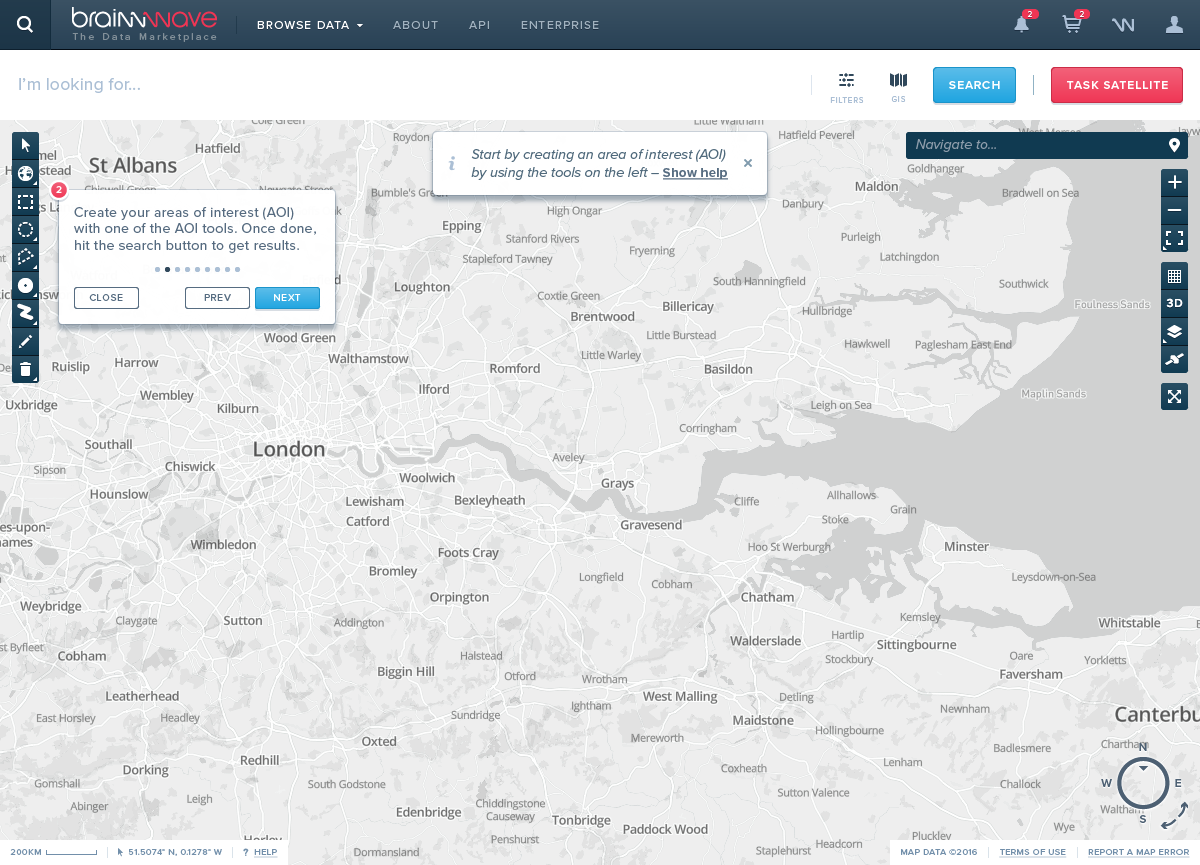
GEOGRAPHIC INFORMATION SYSTEM
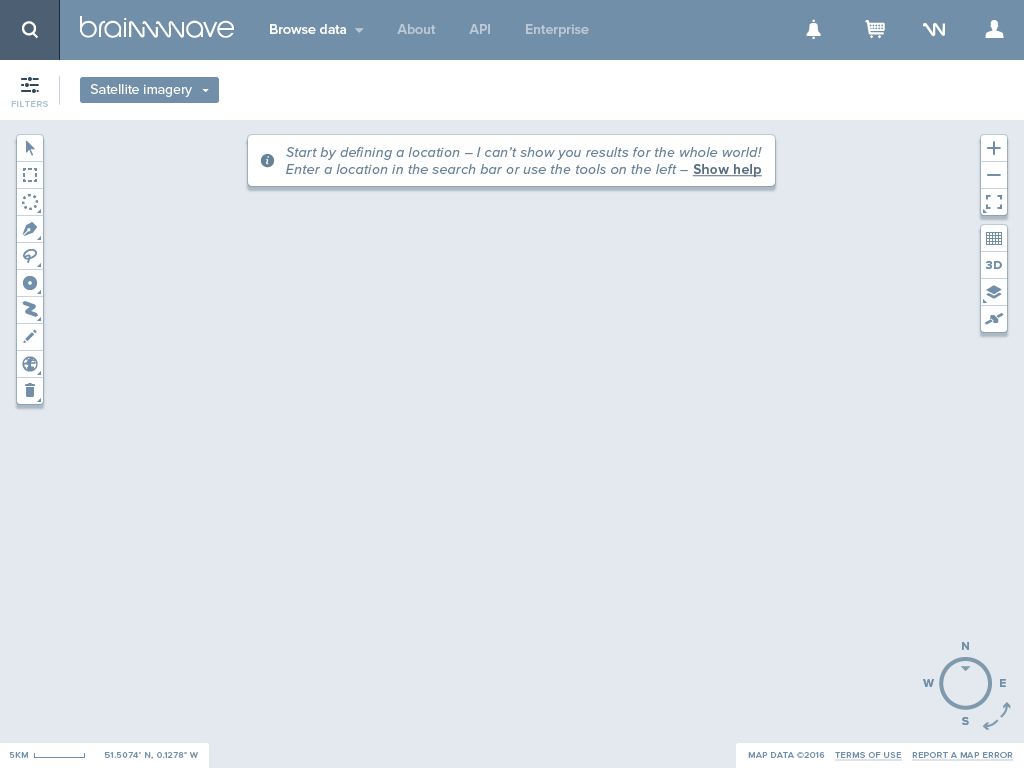
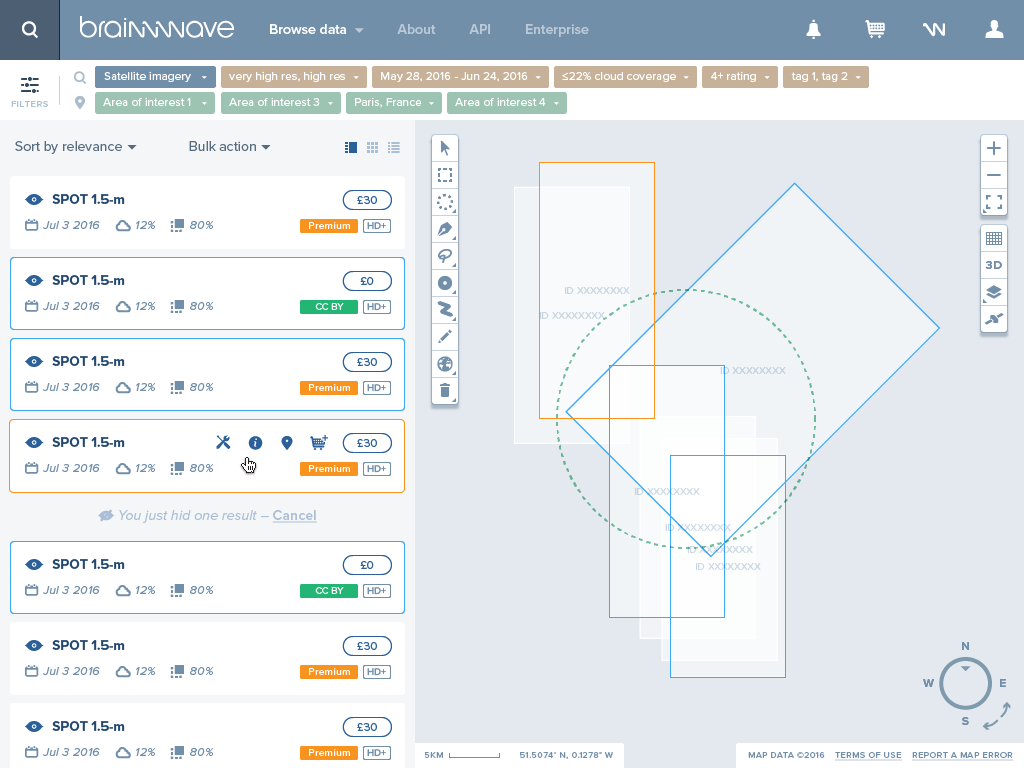
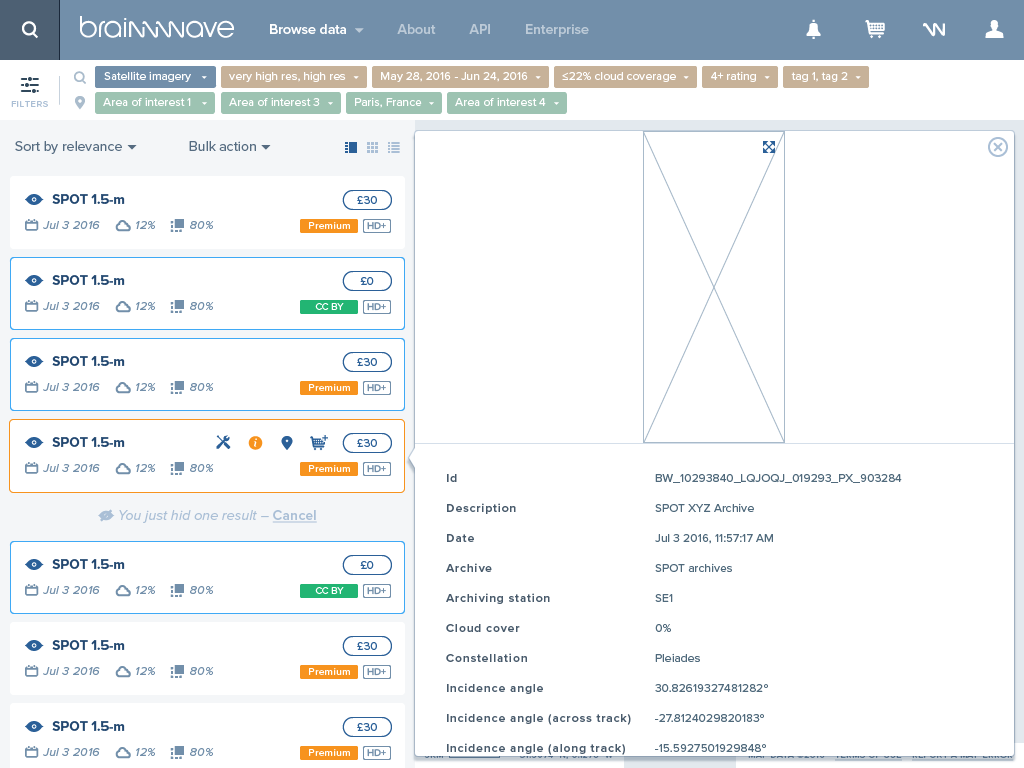
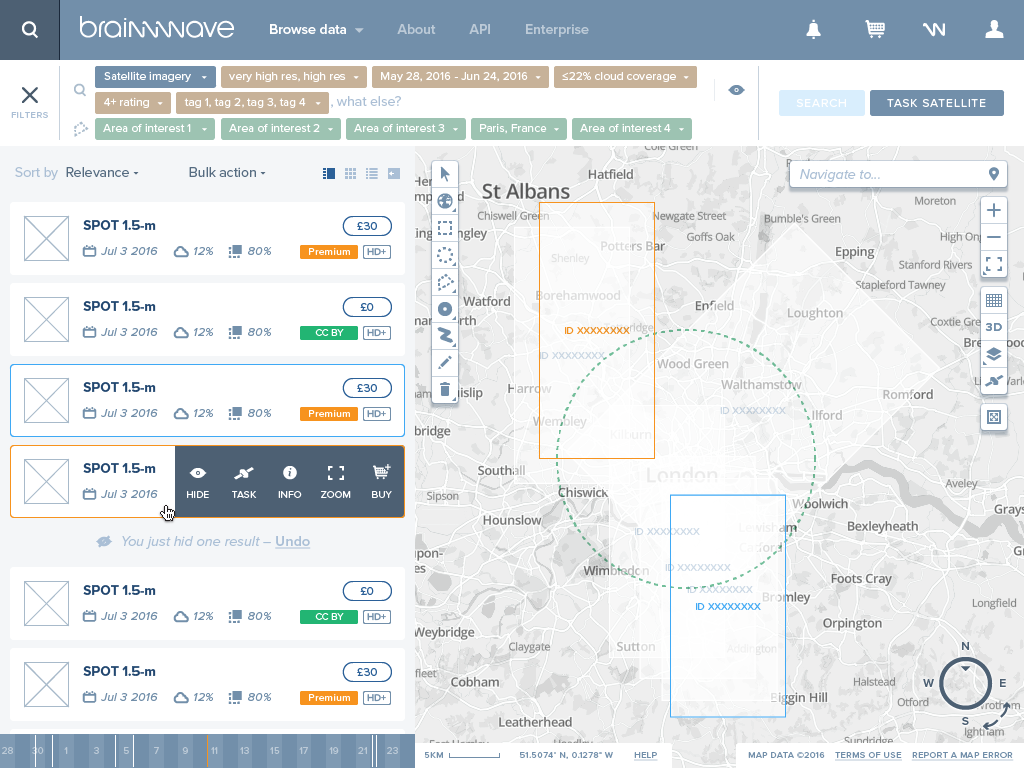
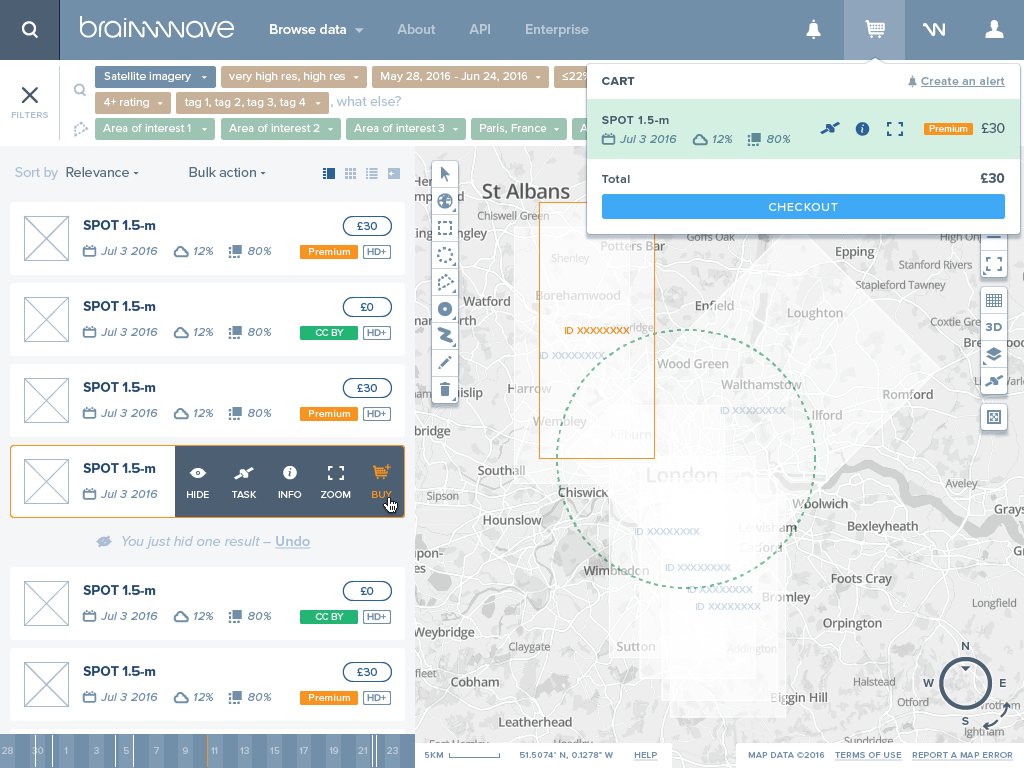
Happy with the Marketplace design, Brainnwave came back with a new challenge: including access to satellite imagery to the platform. This brought a lot more features to the interface, and our first reflex was to create a dedicated section for the GIS.
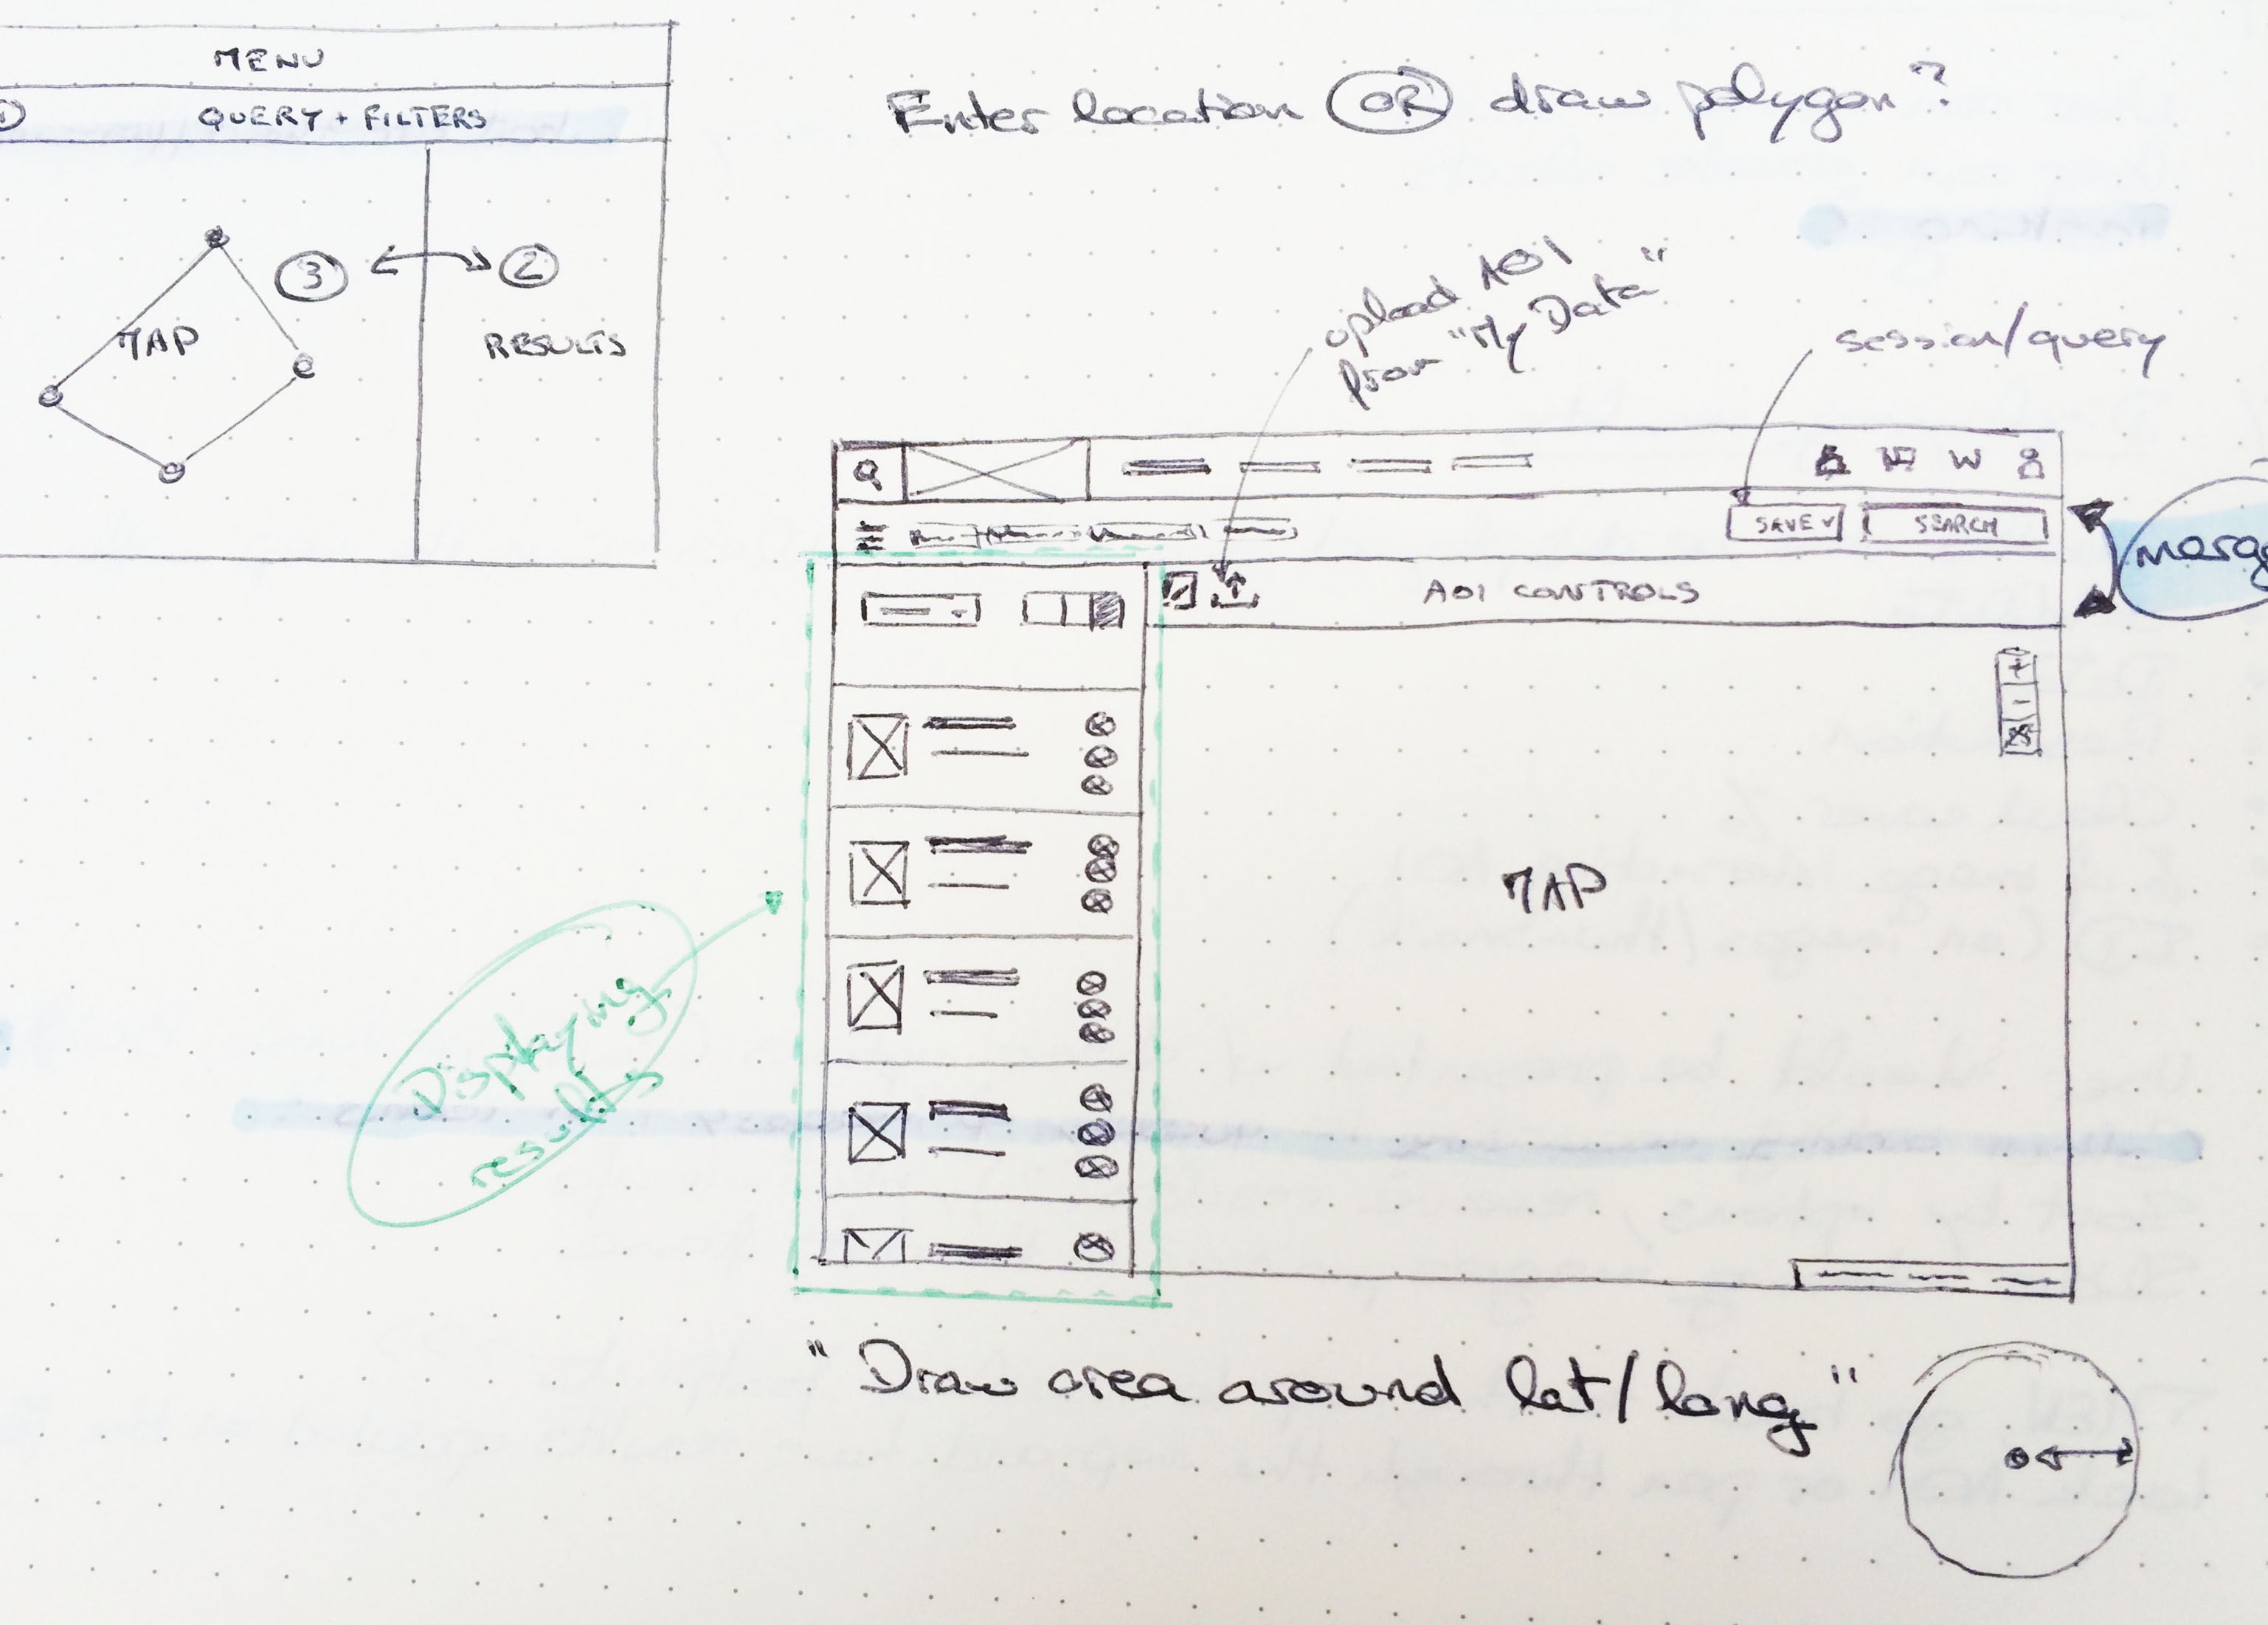
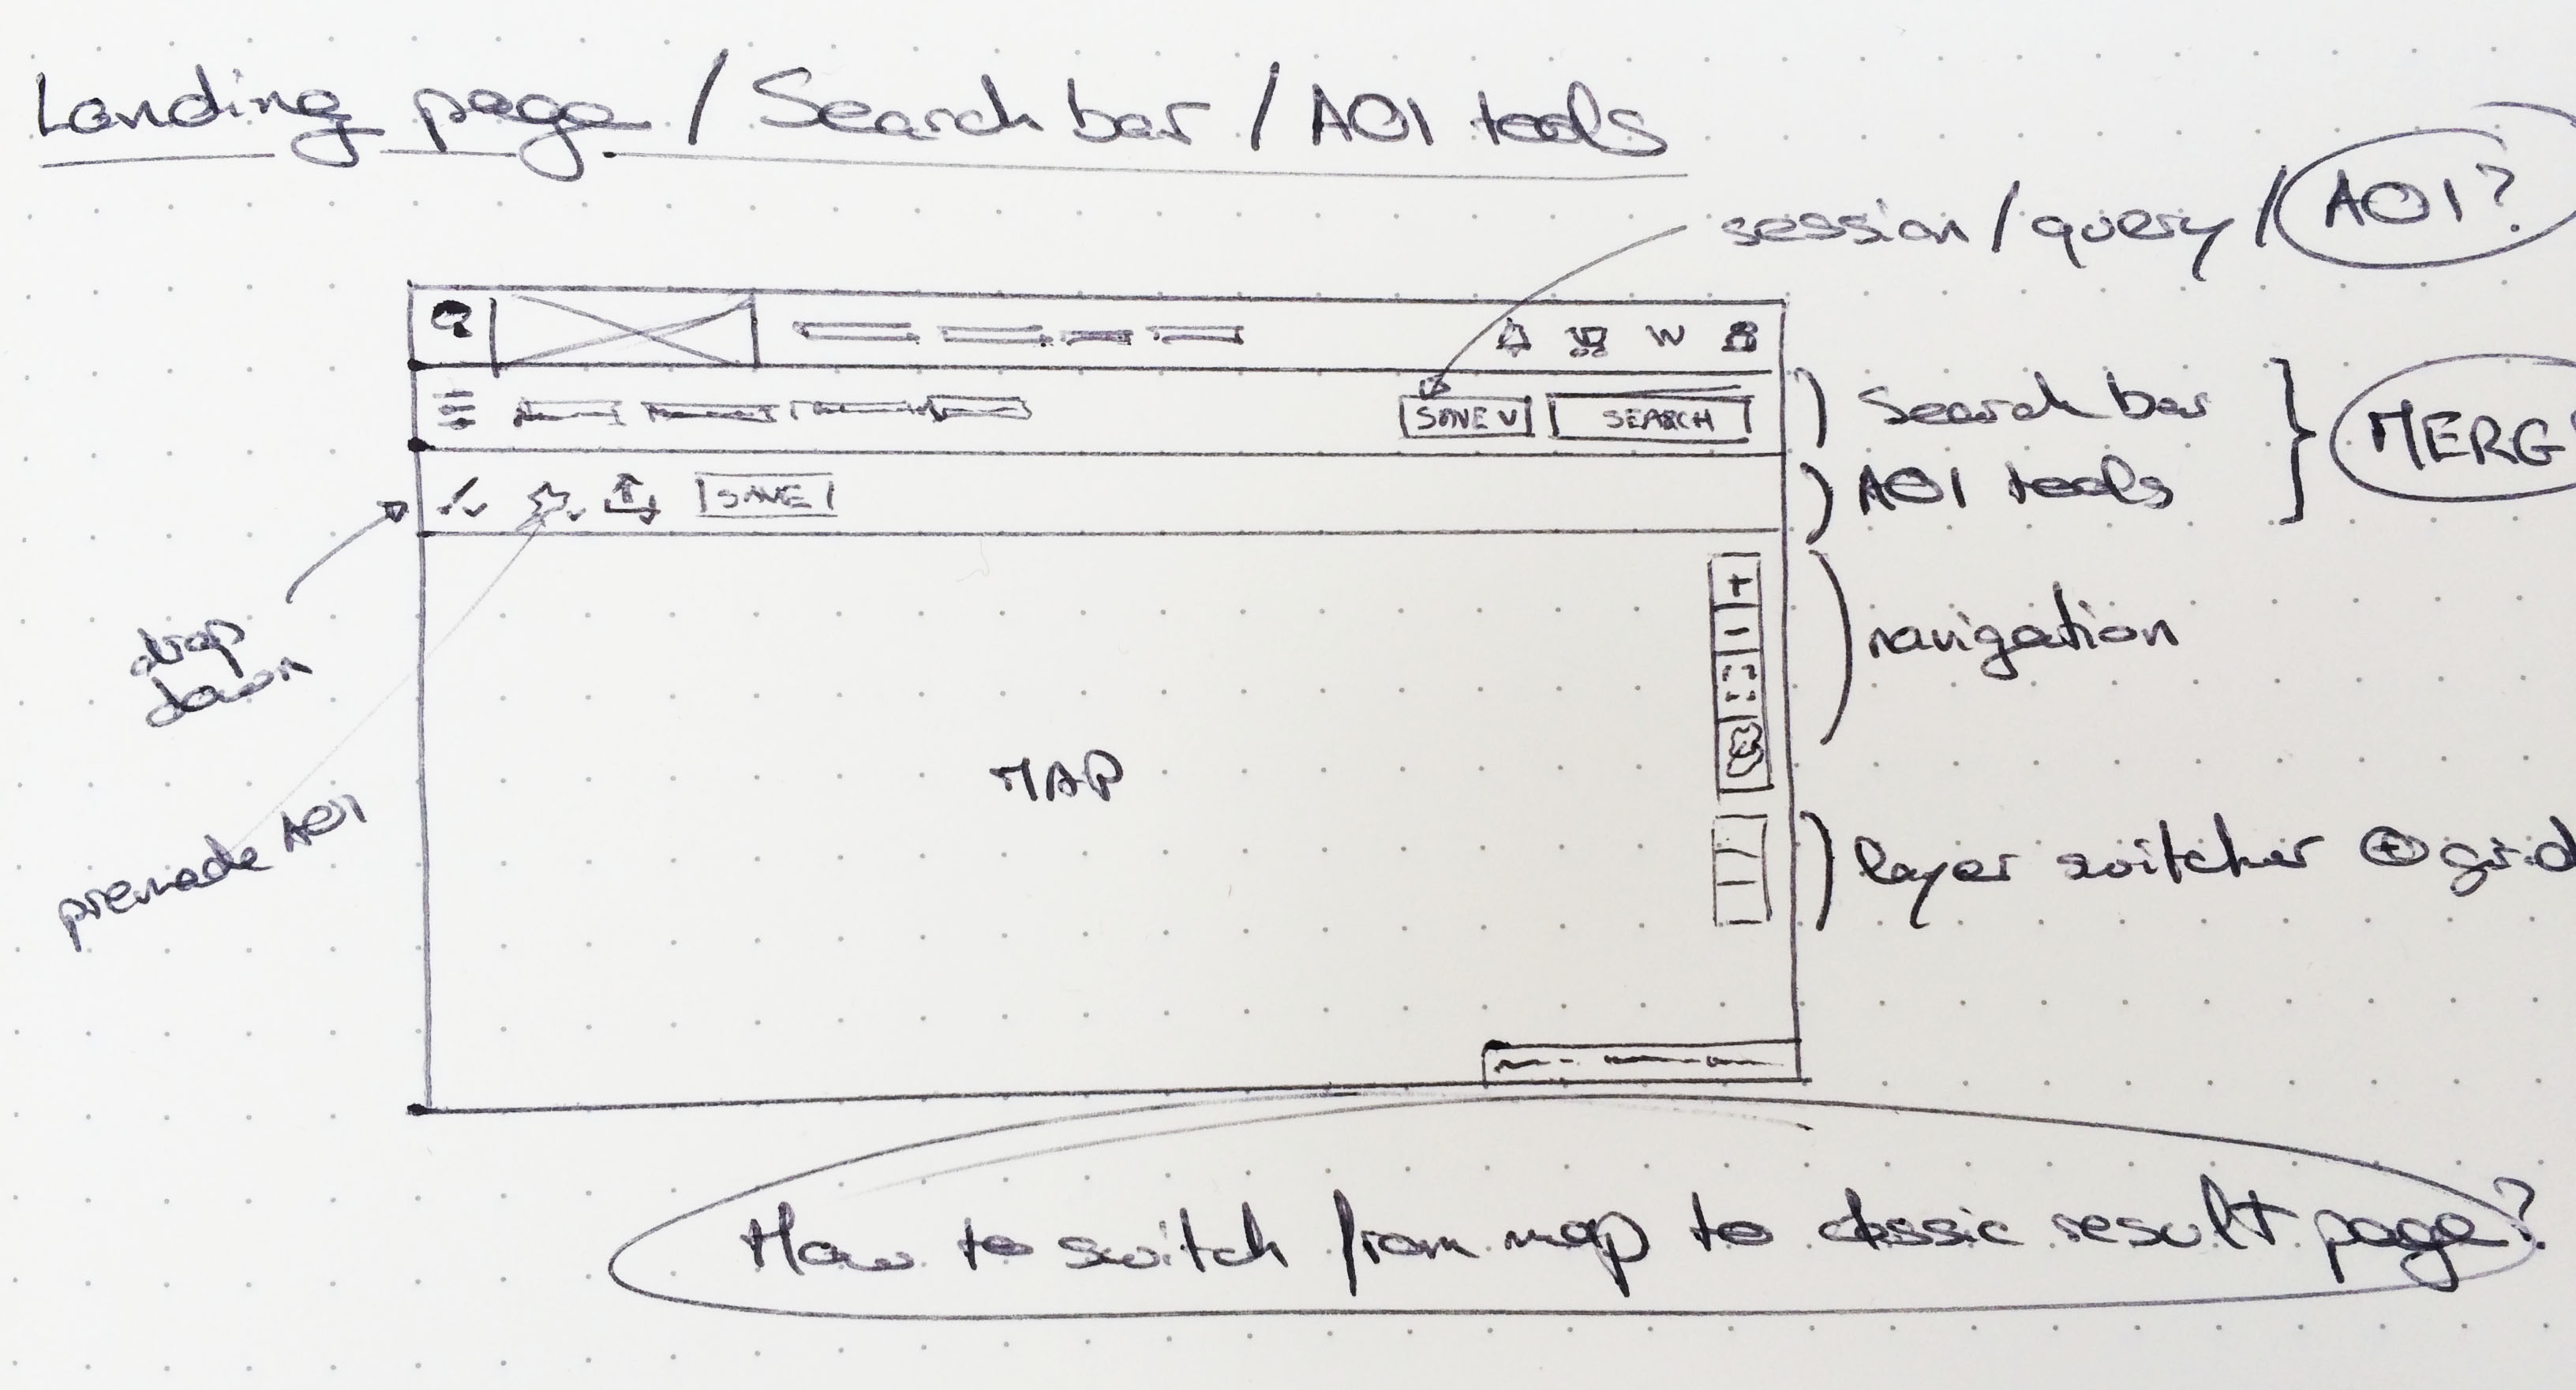
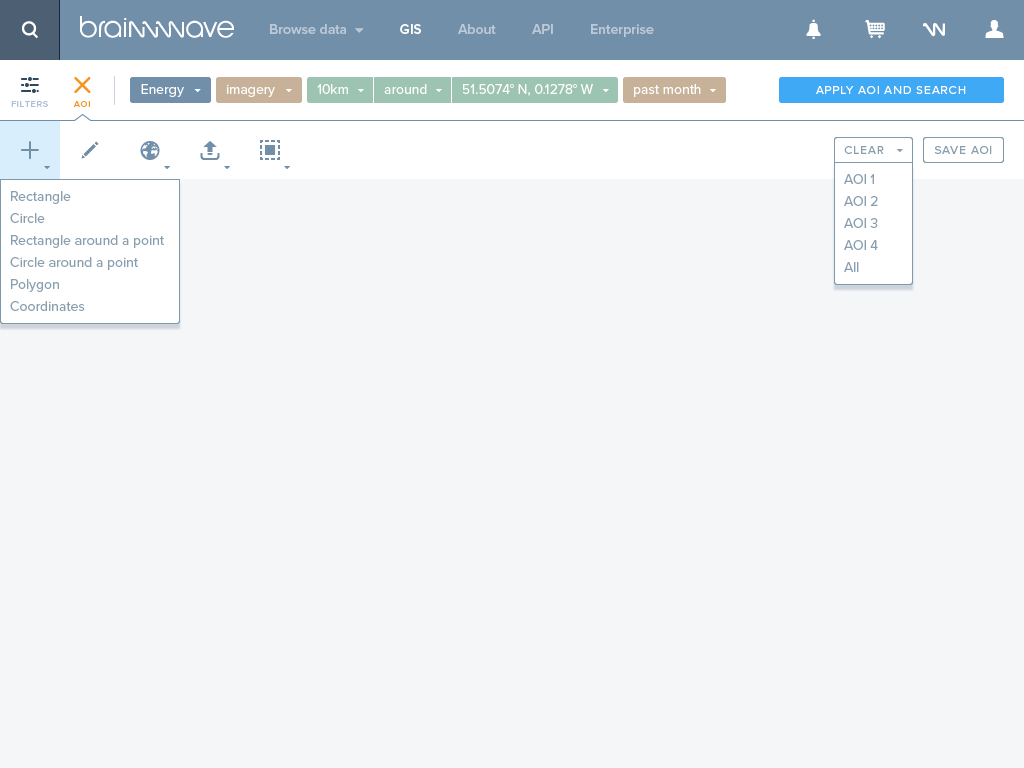
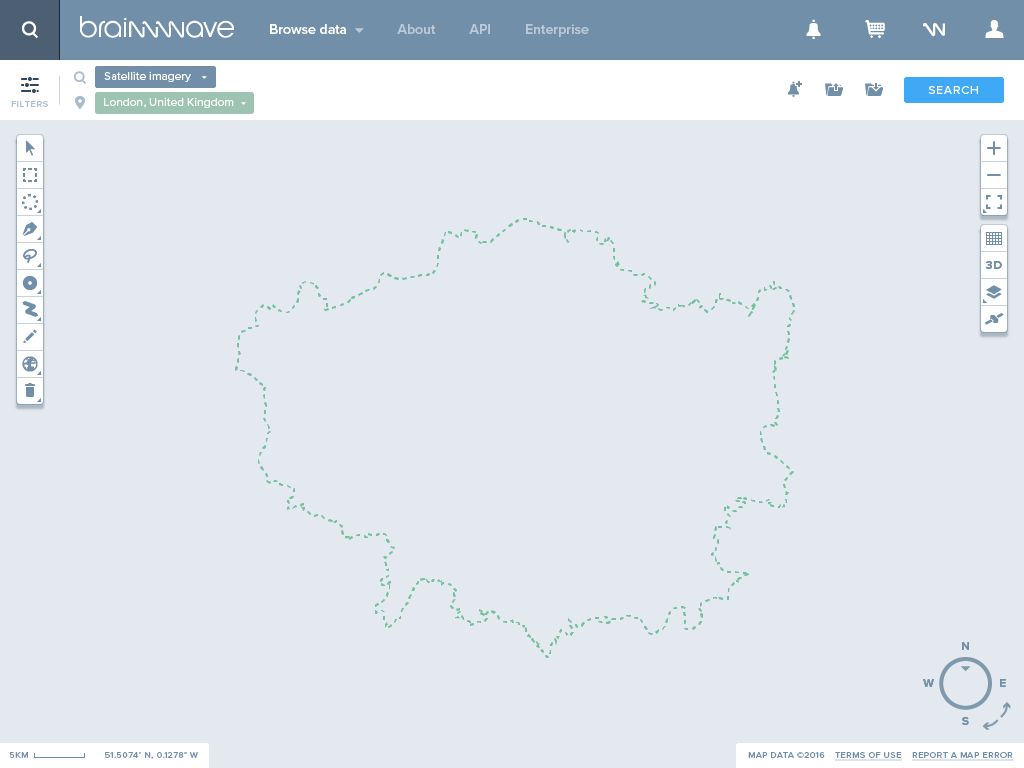
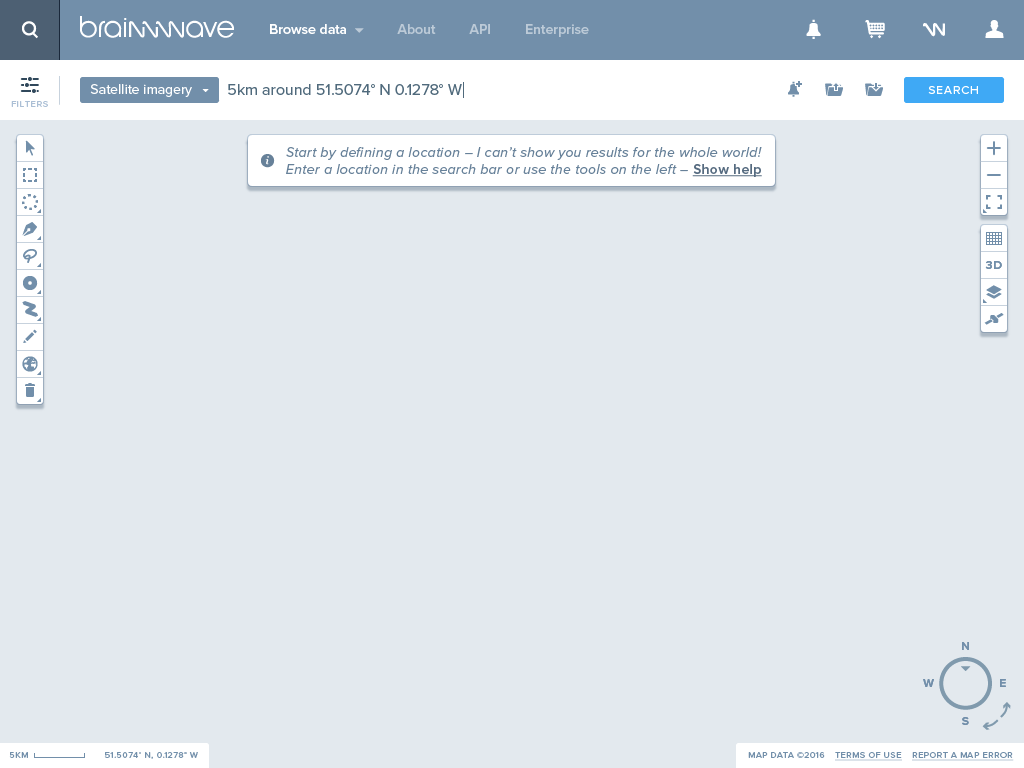
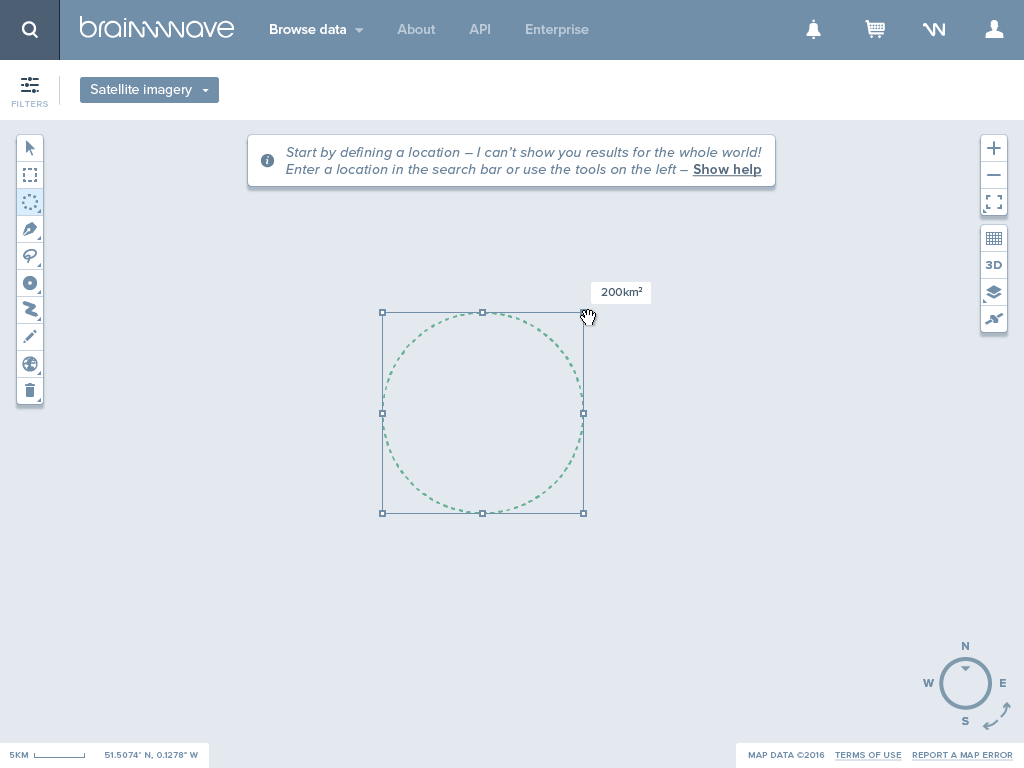
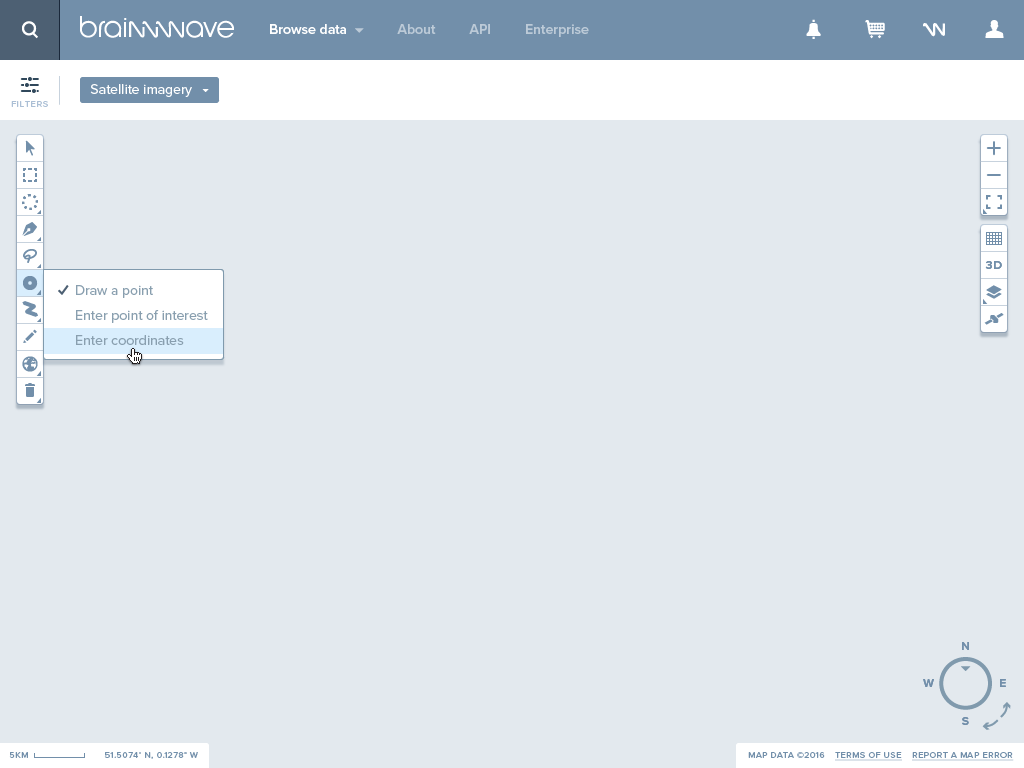
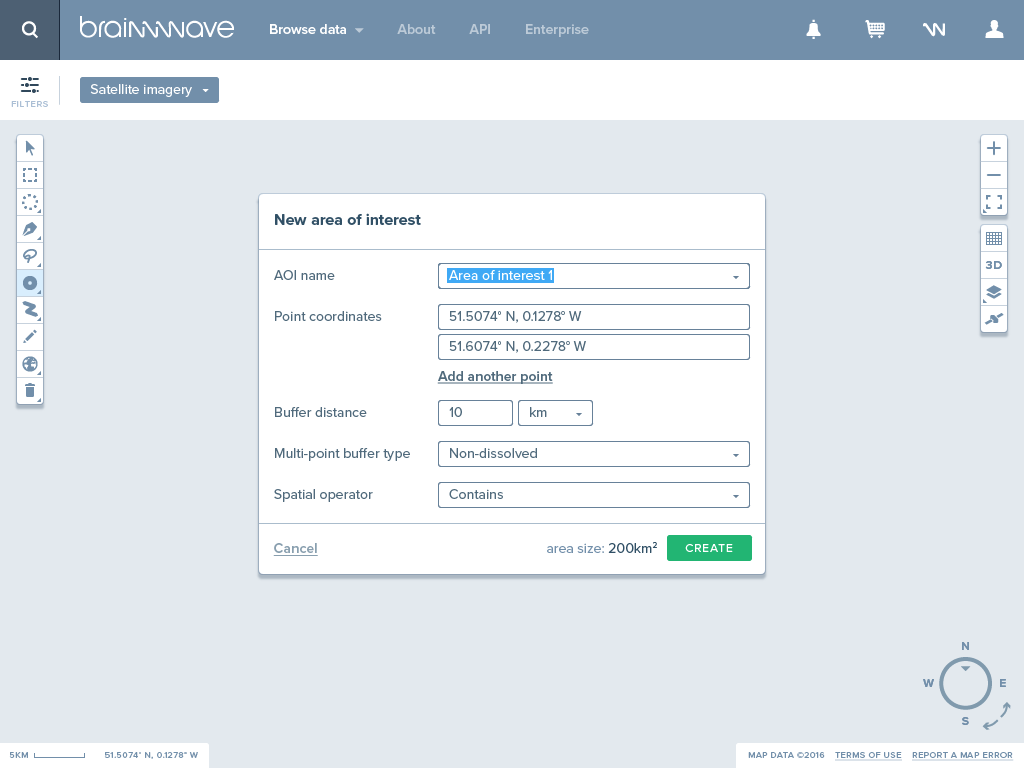
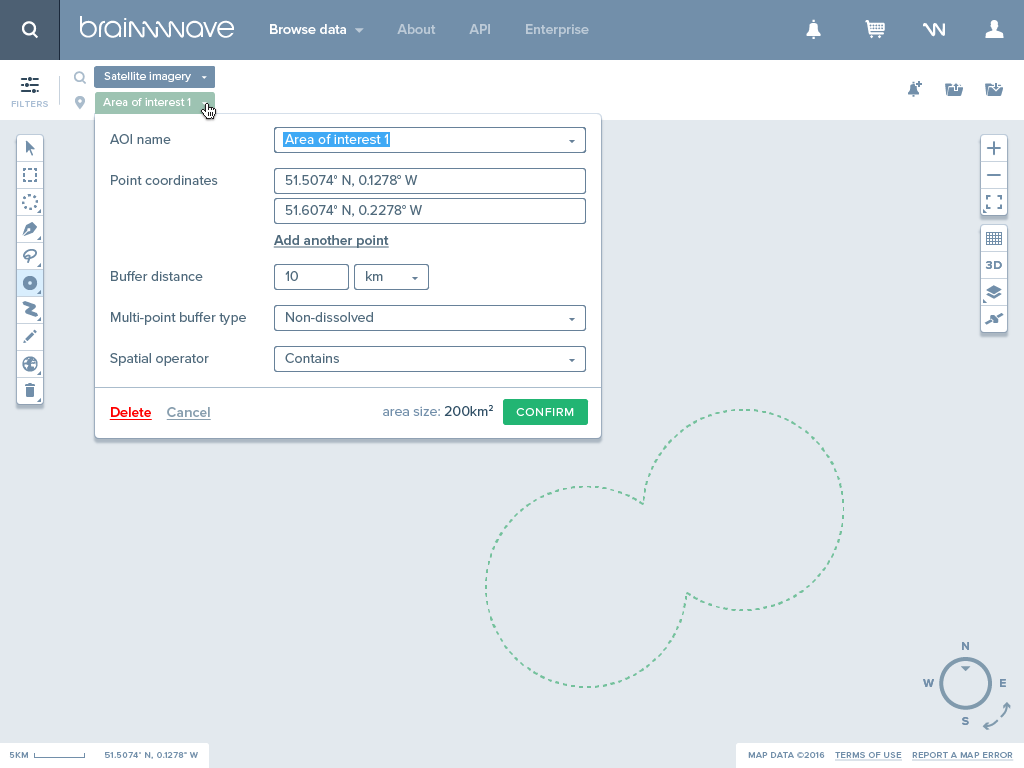
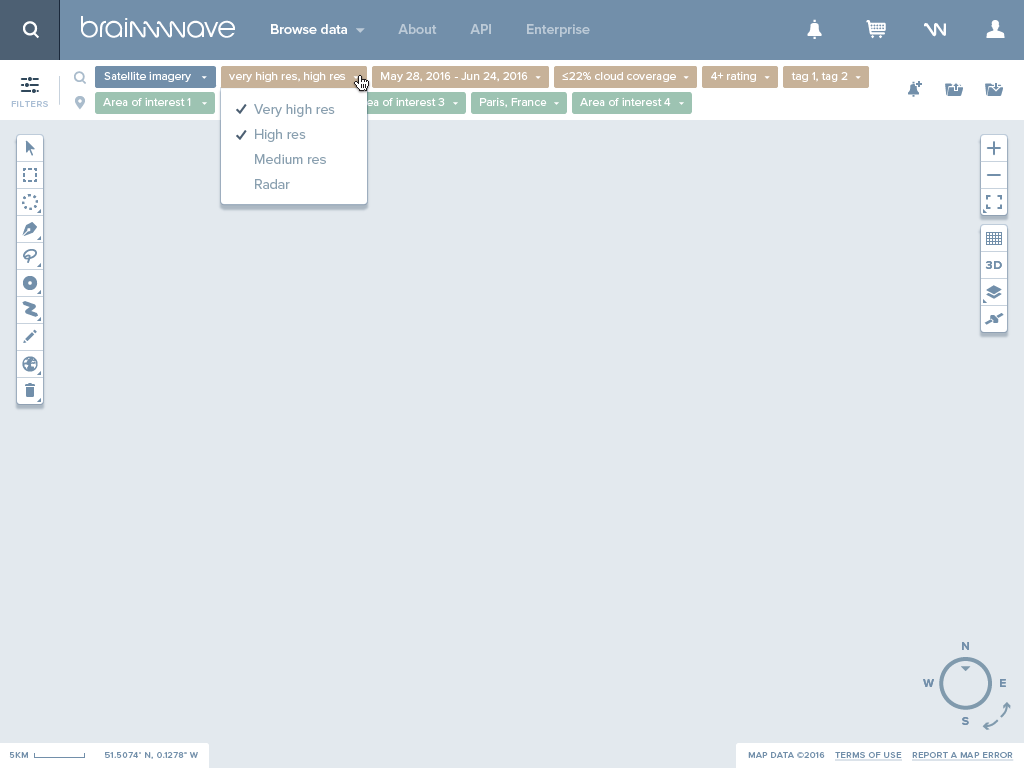
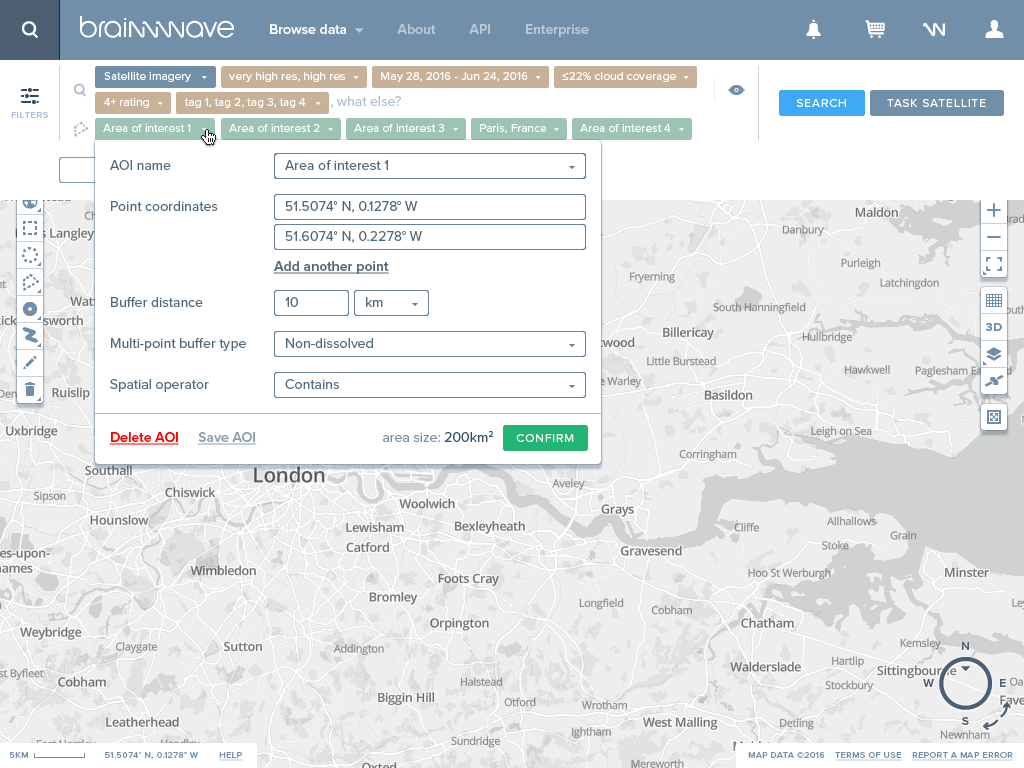
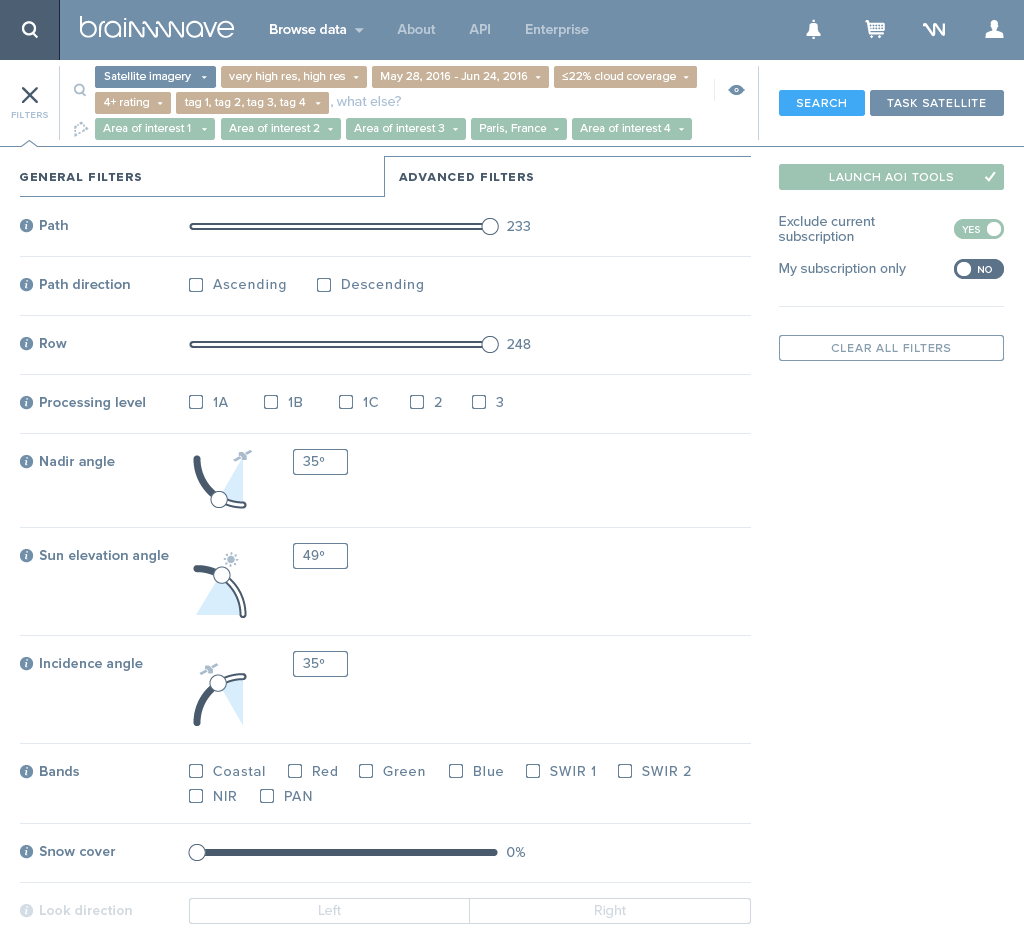
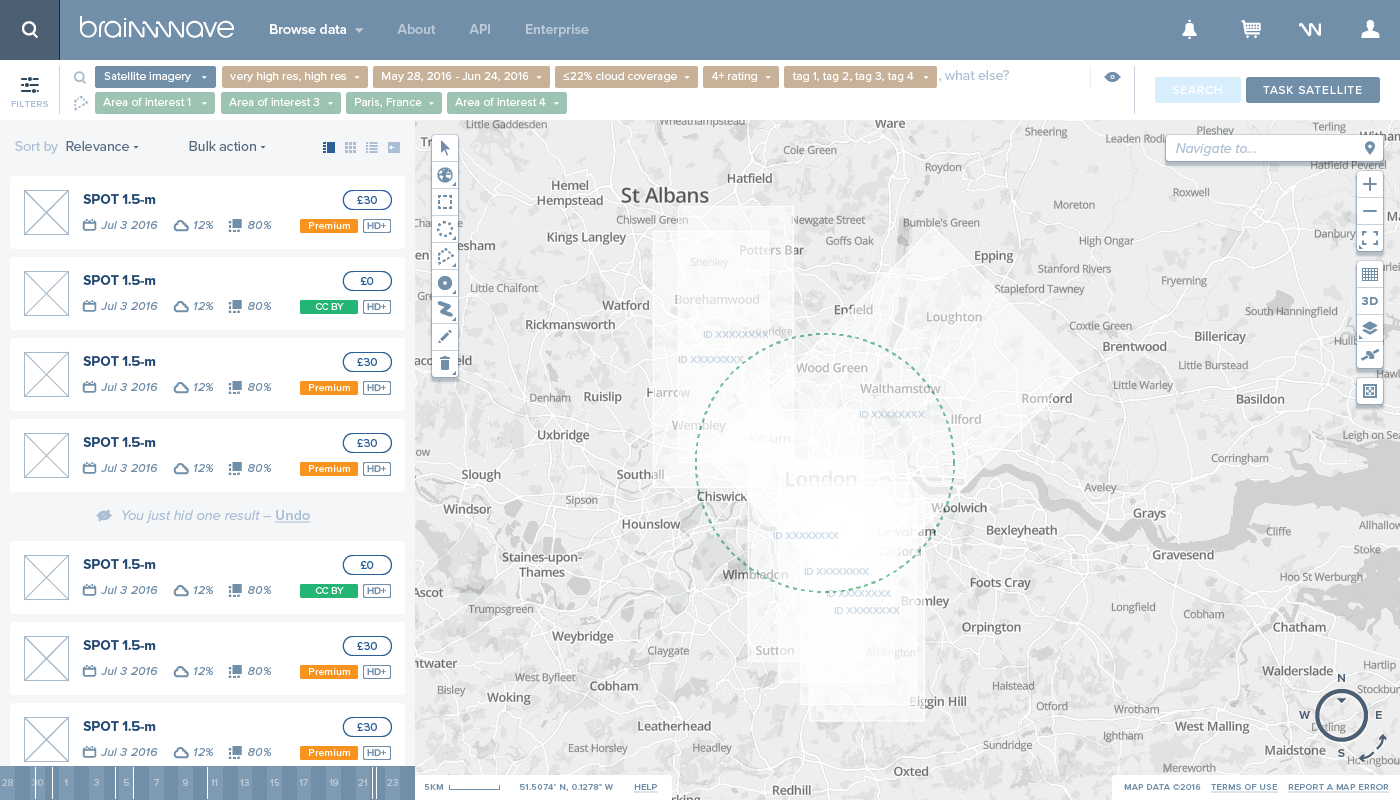
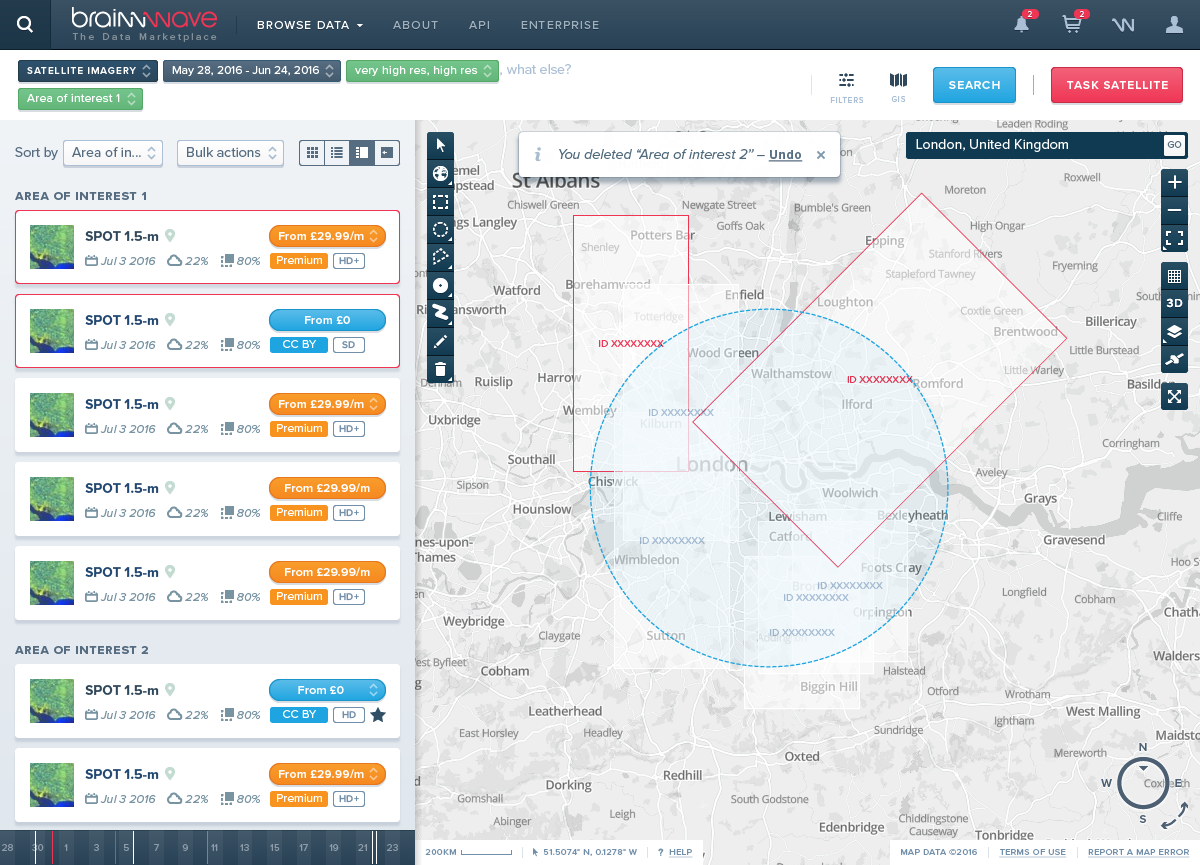
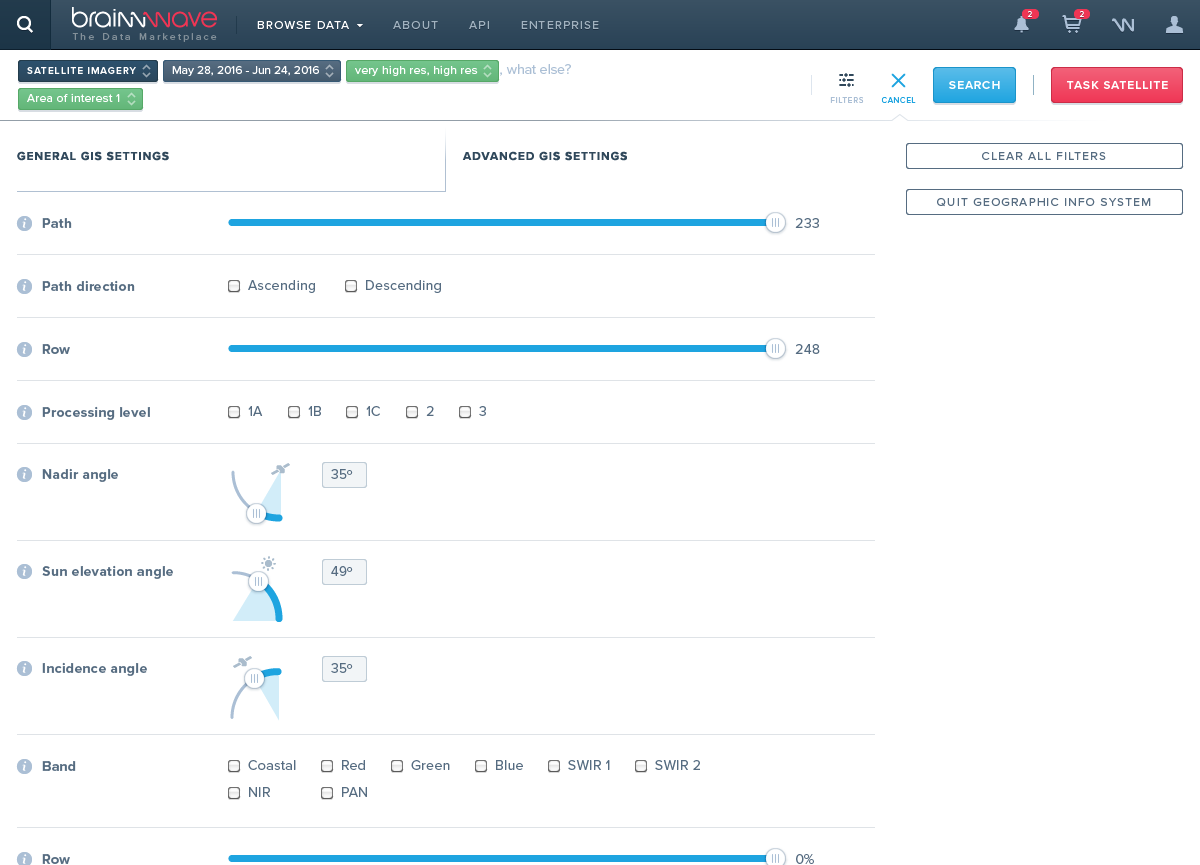
GIS filters and ‘areas of interest’ (AOI) can be typed in the query builder. AOI are simply a selection on the map of an area you’d like to find satellite imagery for: they are expressed in longitude and latitude. New filters for the GIS include cloud coverage, resolution, satellite elevation angle, etc.
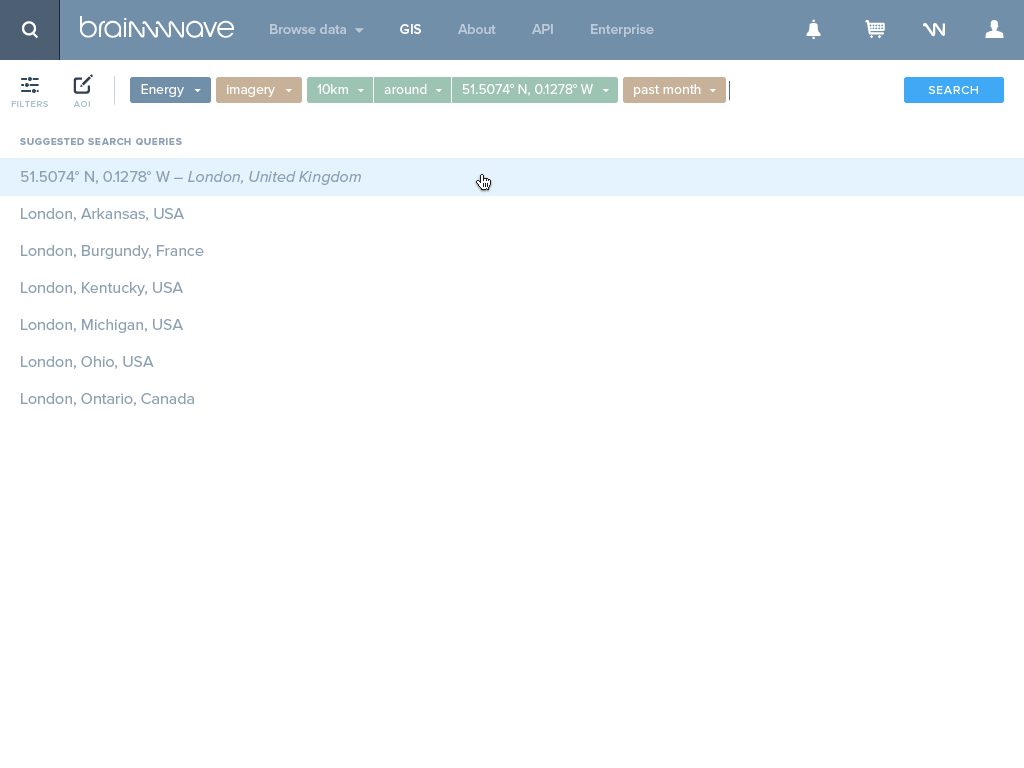
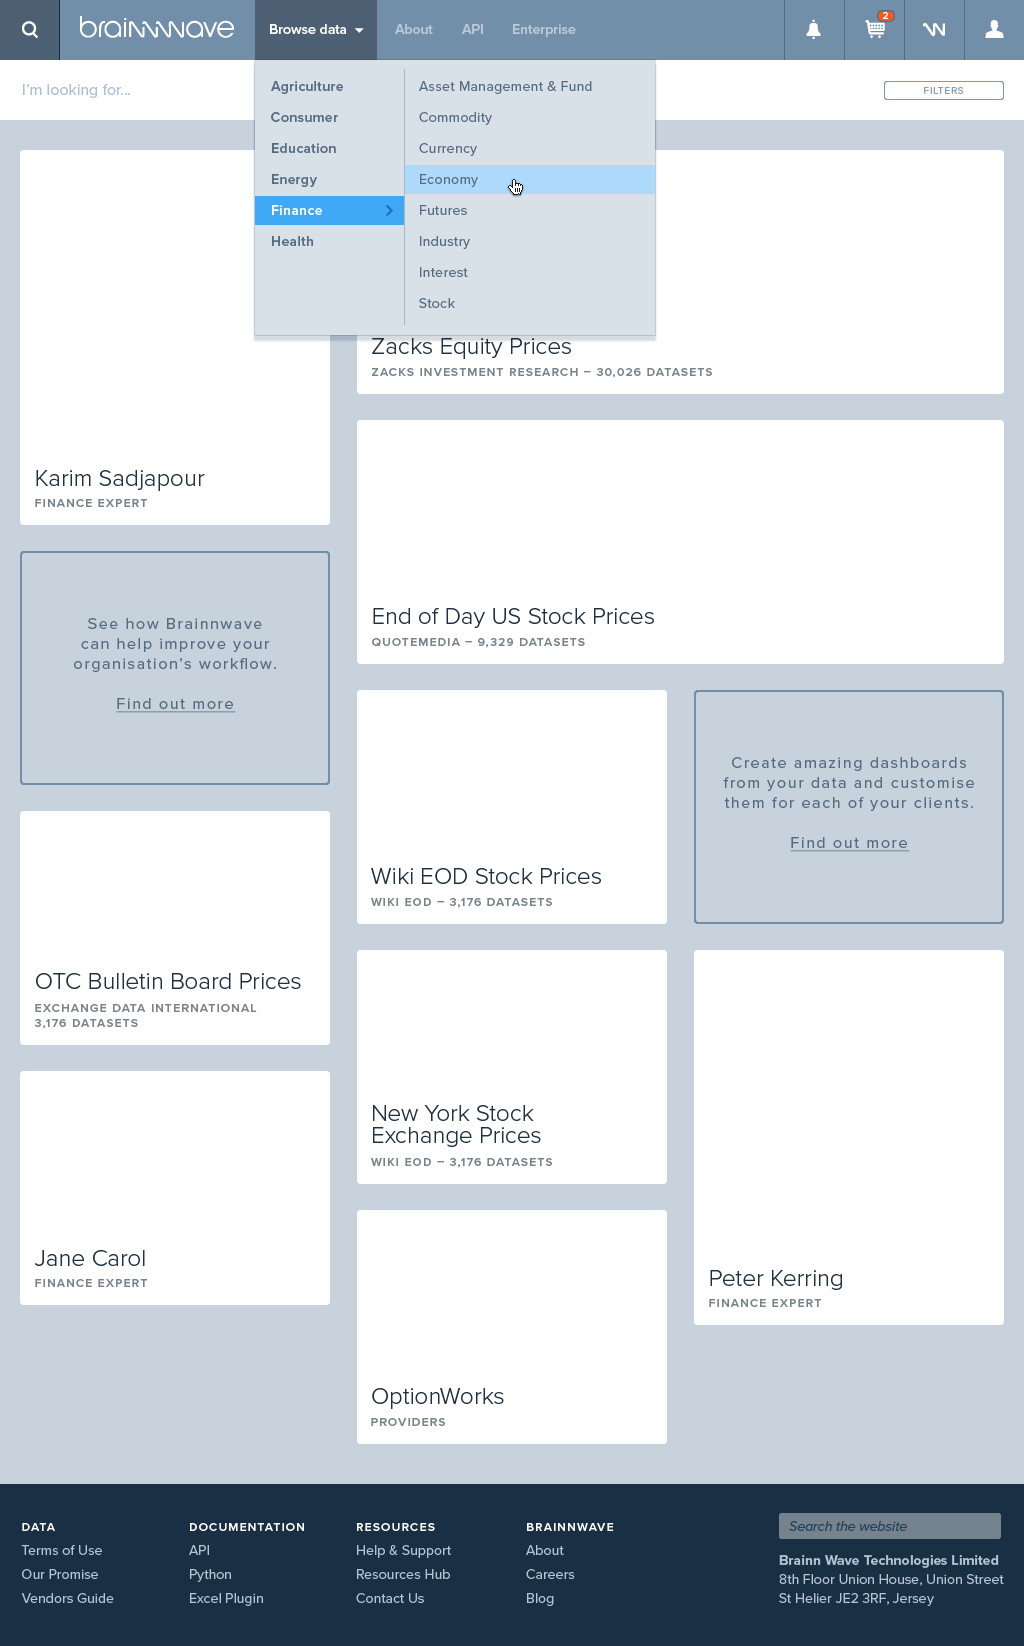
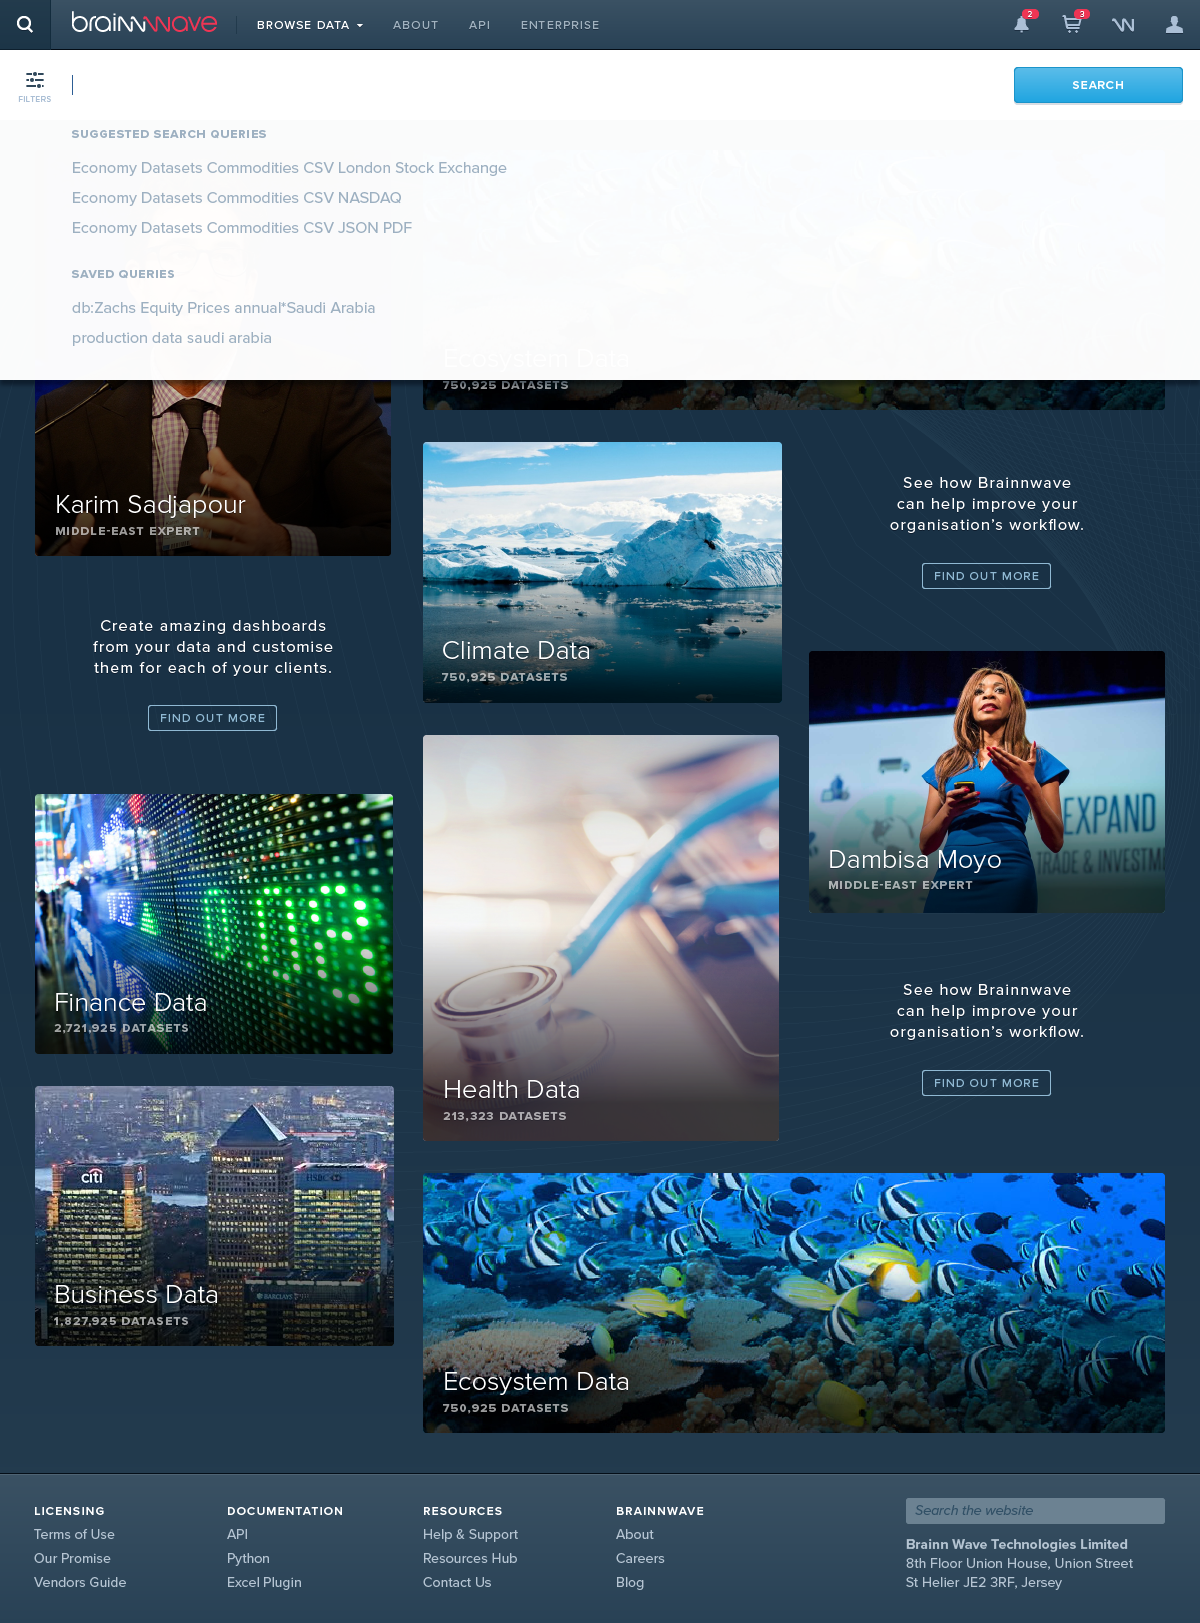
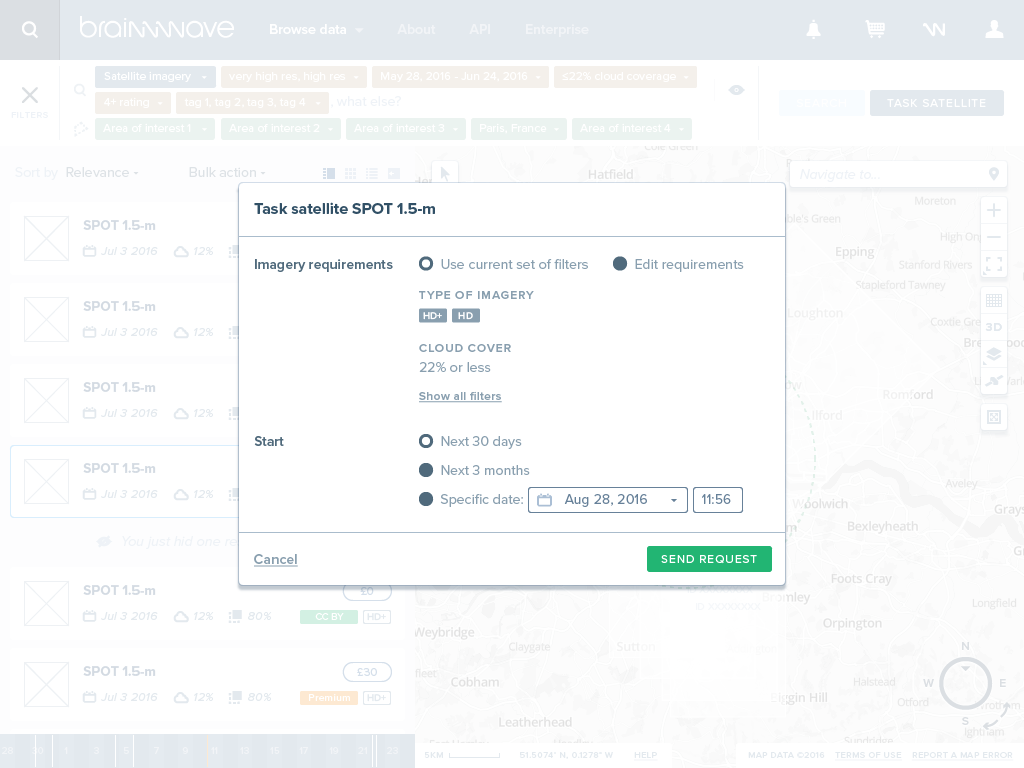
However after a few tests, we weren’t quite happy with the GIS being separated with the rest of the marketplace (‘Browse data’ in the navigation). So we dropped the dedicated section and brought the GIS under the ‘Browse data’ tab. Alongside Energy, Finance, Health, etc., a new category of data was defined: Satellite imagery. Now users can simply type what they’re looking for in the query builder from the homepage, be it ‘Energy’ or ‘Satellite imagery’, classic datasets or AOI coordinates, and be redirected to the tool that best suits their need, the standard marketplace or the GIS interface.
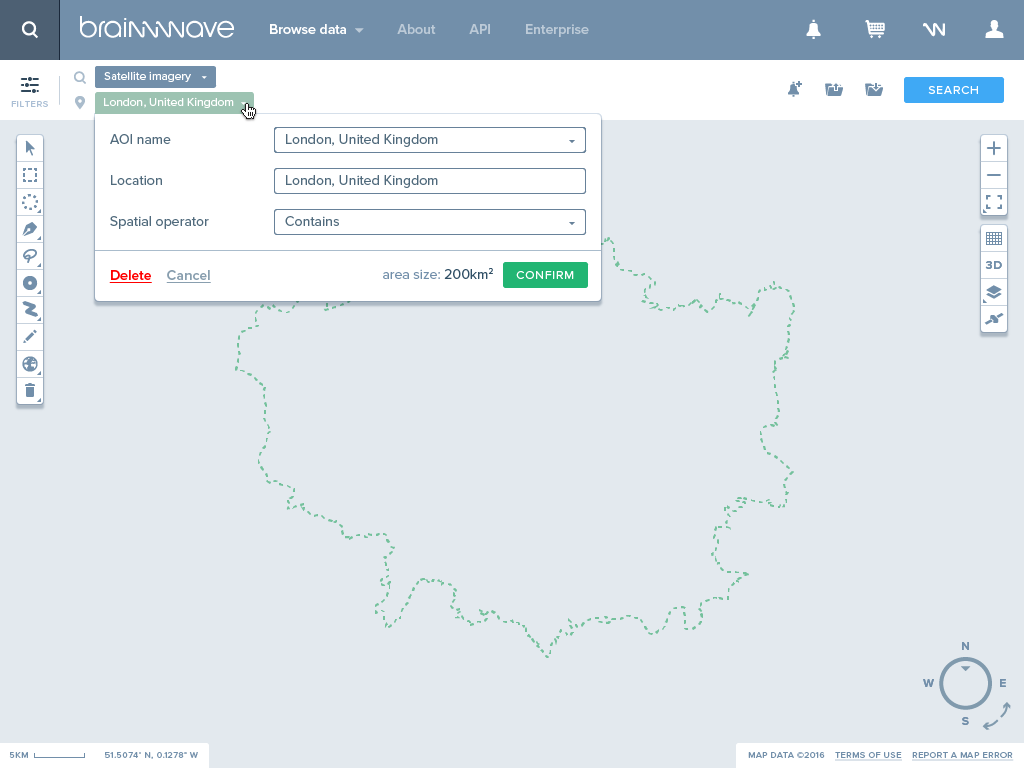
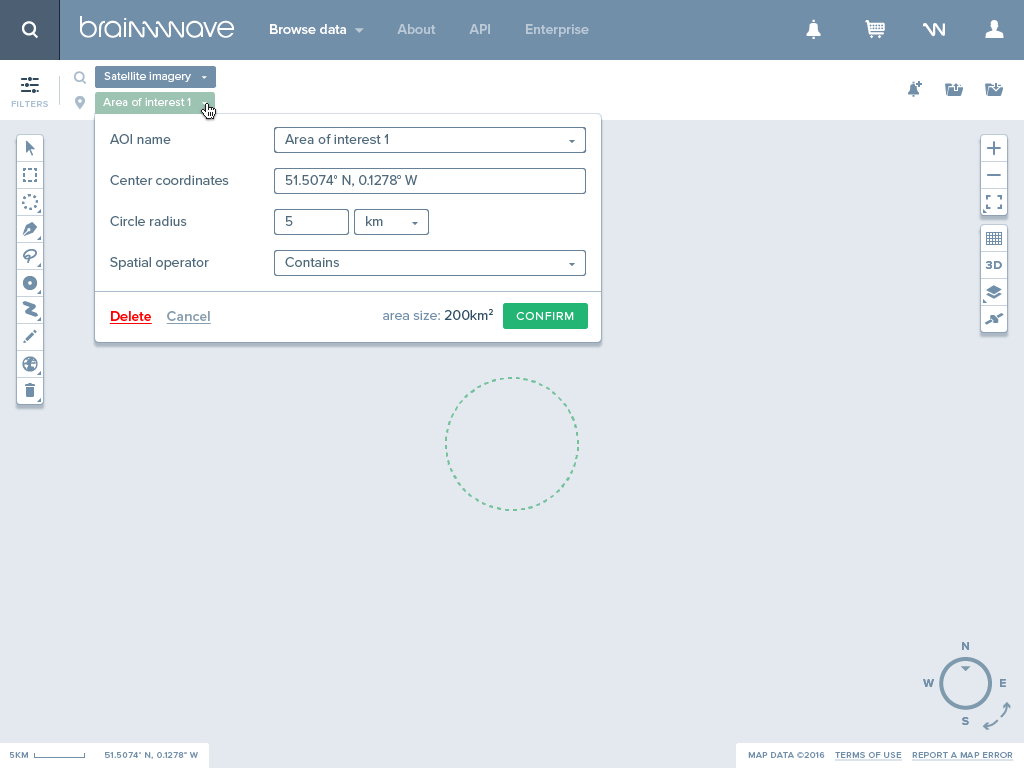
Users also have the option to define AOI with a form rather than by drawing on the map.
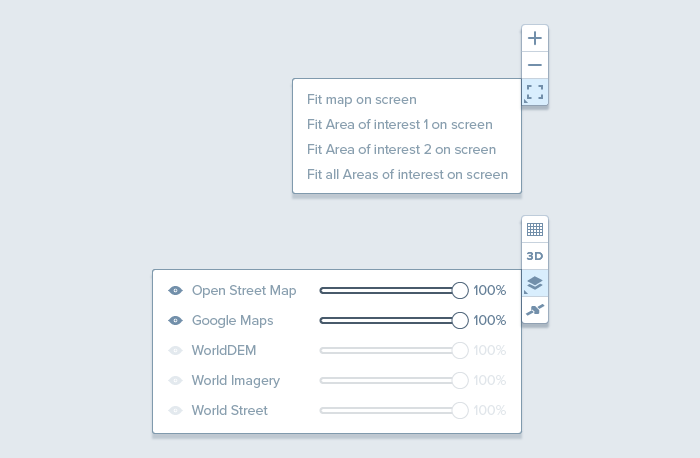

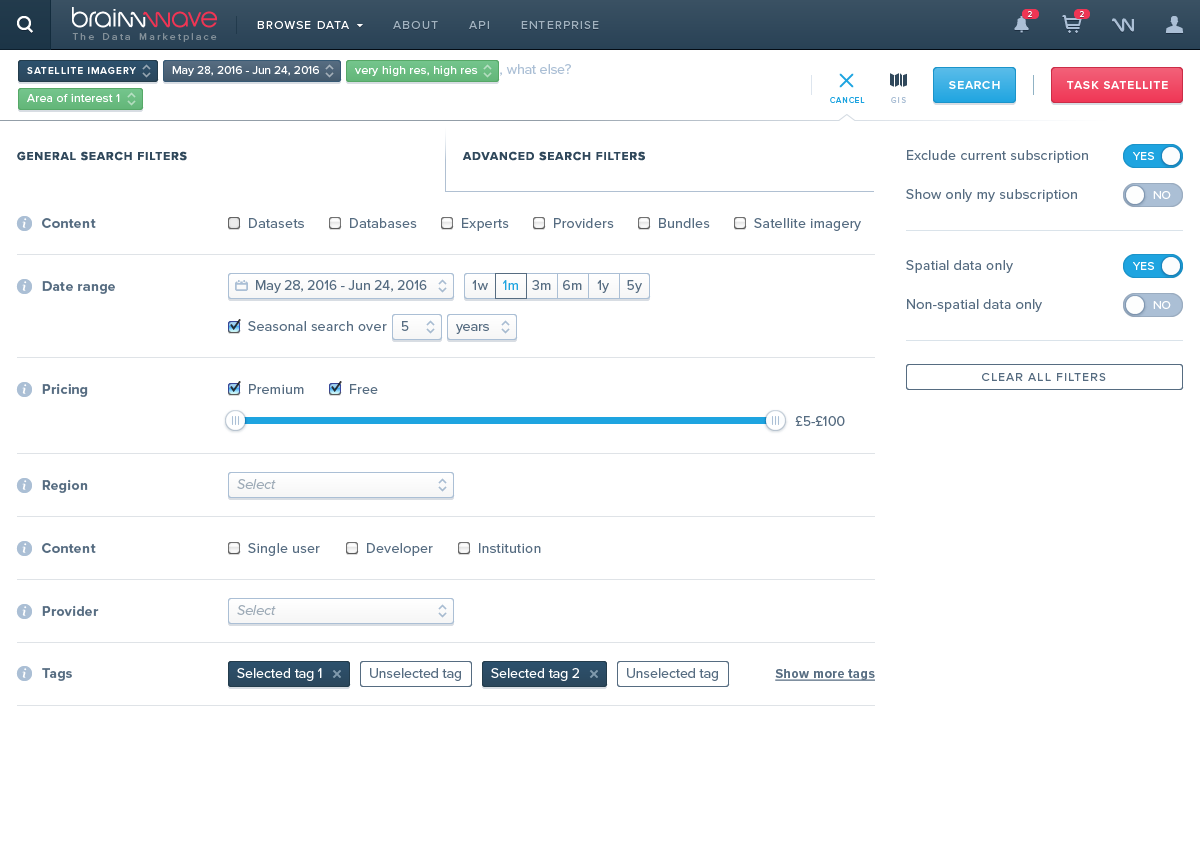
We worked with a small resolution to make sure the interface would work without too much problems on small screens. We also worked on how the interface would stretch on bigger canvases, especially on HD screens where, at this point, a side panel for the filters made a lot more sense than taking up the full screen.
The visual design phase was the occasion to test whether or not the visual language system I conceived for the marketplace was flexible enough to accommodate new interfaces, especially with the call-to-action hierarchy.
CONCLUSION
Considering the complexity of the product, I was quite satisfied of the result but especially how seamless the process was. We made great use of Trello to organise the backlog of features and user-stories at the beginning of the project, switching to JIRA later in order to better coordinate with Brainnwave’s developers.
It’s always great to be involved in a project from start to finish, from the early brainstorming sessions and sketches, to the backlog maintenance, the wireframes, the multiples iterations, the visual designs and documentation.


